This Year's Summer Trends?
Our New York City real estate market moved into last month on overall positive trends from the first quarter. Though we saw decreased sales in Q1 – realized from the lower level of contracts signed in the last quarter of 2023 – both Manhattan and Brooklyn saw an increase in contracts signed, signaling an increase of sales for this quarter. Below we’ve included Q1 market performance highlights for both boroughs.
As we move through Q2, April saw an overall increase in property inventory, though an upward shift in mortgage interest rates, reversing the trend we had been experiencing. The Fed has also signaled less likely rate decreases ahead, suggesting the continued lending trend. Buyer sentiment has been increasing and seller negotiability has trended the same in general across the market. As we move through this new quarter with the rate environment, we look ahead to a summer in which buyers, particularly in the $1.5M and below sectors, again consider locking in pricing on the homes they desire, with an eye to refinancing with future rate decreases.
Manhattan
- Property inventory continued to stay low at around 6,000 active properties on the market.
- Most properties on the market were priced between $1M-3M, and these units had no significant change in any price metric compared to last year.
- New listings were up 27.5% from the prior quarter, but still down 4.9% year-over-year, continuing the general inventory shortage.
- The number of properties listed for less than $500k was up 14.1% year-over-year, with a 4.1% increase in median price.
- Slow-to-close contracts from the prior quarter led to a decline in sales of 5.2% year-over-year and 13.7% quarter-over-quarter.
- Sales price performance was mixed, with condos seeing a 9.8% decline in average price, while co-ops climbed 7.6%, compared to Q1 2023.
- 71% of transactions were between $500K-$3M, with a 3.6% decline in average price per square foot in these properties, improving affordability for buyers.
- Signed contracts were up 1.7% year-over-year and 9.3% quarter-over quarter, hinting at a positive market trend as we progress into 2024.
- Performance across apartment types was split, with condos seeing slightly less contract activity, falling 0.9% compared to this time last year, but commanding higher prices, while co-ops were up 3.7%, with modest price movement.
- The $3M-5M price point saw 15.7% more contracts signed than last year, followed by the $5M-10M range with 9.6% more activity.
- One-bedroom units were the most common trade, and the only unit type to see year-over-year decline, falling 9.7%.
Brooklyn
- Property inventory improved overall, climbing 2.6% year-over-year and 11.3% quarter-over-quarter.
- Condos on the market had an 11.1% higher median price than Q1 2023, while co-ops were down 1.1%.
- There were 3.4% fewer new listings compared to Q1 2023, but 25.5% more compared to the prior quarter, with houses having the largest increase of 6.6% more than last year.
- Overall, sales fell 10.3% year-over-year and 6.7% quarter-over quarter, with prices slightly higher and an increase in average price per square foot.
- Condos fared the best, with only a 2.9% decrease in sales compared to last year, and moderate improvement in all price metrics.
- Higher-priced condos had a strong performance, with more sales than last year in all price brackets at or above $1M.
- North Brooklyn saw 2.4% fewer sales this quarter, though there were 9.7% more condo closings in the area year-over year.
- Contracts signed fell 4.7% year-over-year, while climbing 8.6% quarter-over-quarter.
- Houses saw a 1.5% increase in contracts compared to last year, while condos were down 4.2%.
- South Brooklyn, the largest geographic area, continued to be the predominant submarket, with 41.5% of contracts, but Northwest Brooklyn, consisting of most Brownstone Brooklyn neighborhoods, Downtown and Gowanus, captured 30.6%, with a significant improvement in condo activity in the area.
- Most contracts signed were priced $1M-2M with 37.3% of activity, and this price group was the only one to see year over-year improvement, climbing 15.4%.
By this time next month, we will be moving into summer, with the trends set on the sales we will realize from April and May market activity. If we see a continued increase in overall inventory, and stable buyer sentiment, we anticipate an active final month for the Spring market.
-----
The Numbers
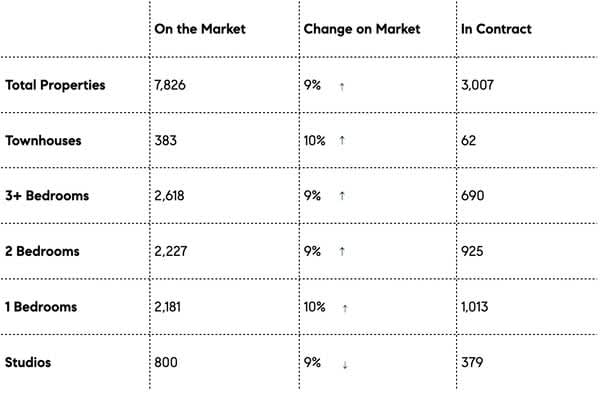
Manhattan Market Activity
Highlighting our market's past 30 days.
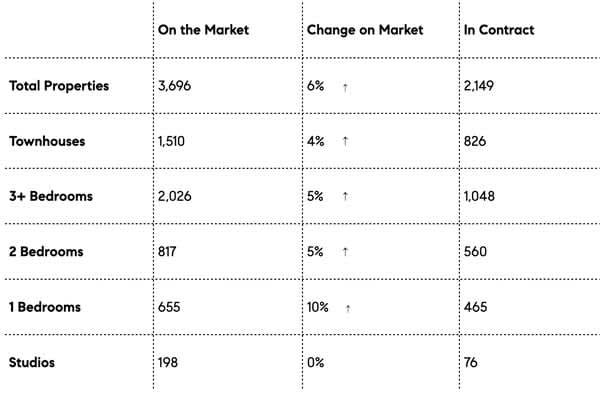
Brooklyn Market Activity
Highlighting our market's past 30 days.
---------
The Properties
Our month's featured listings on the market.

Upper West Side / Manhattan
Co-op
2 Beds / 2 Baths
$3,995,000

Ditmas Park / Brooklyn
Condo
2 Beds / 2 Baths
$580,000

Hamilton Heights / Manhattan
Townhouse
6 Beds / 6 Baths
$3,195,000

Kensington / Brooklyn
Townhouse
4 Beds / 2 Baths
$1,659,000
---------
The Pick
From the cool and eccentric to reserved and irreverent -
Our month’s pick of what's happening in New York City.

If you haven't already, you should:
The Met Cloisters
Enjoy a summer day in the gardens of
Fort Tryon Park and The Met's expansive Medieval art collection.
99 Margaret Corbin Drive, NYC