The resilience of the Manhattan residential real estate market was on full display in the first quarter. A new year and multiple vaccines restored hope. Coupled together with the city's unwavering appeal, inspired buyers purchased dwellings suited for a hybrid world — units with space for home offices, workout areas, and intimate gatherings.
Overall, apartment sales increased 4.8 percent compared to the same period last year and soared 37 percent quarter-over-quarter.
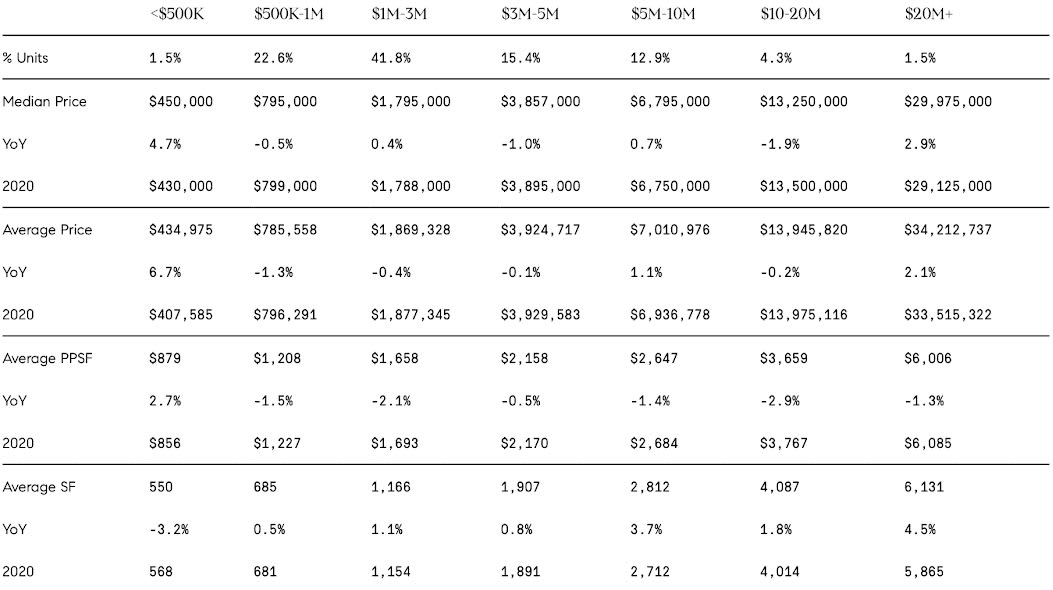
Most notably, units priced in the lower half of the market, between $1 million and $3 million, captured 40 percent of the market — an all-time high. This record was made possible by a strong appetite from local buyers who believe in the city's resiliency and long-term potential.
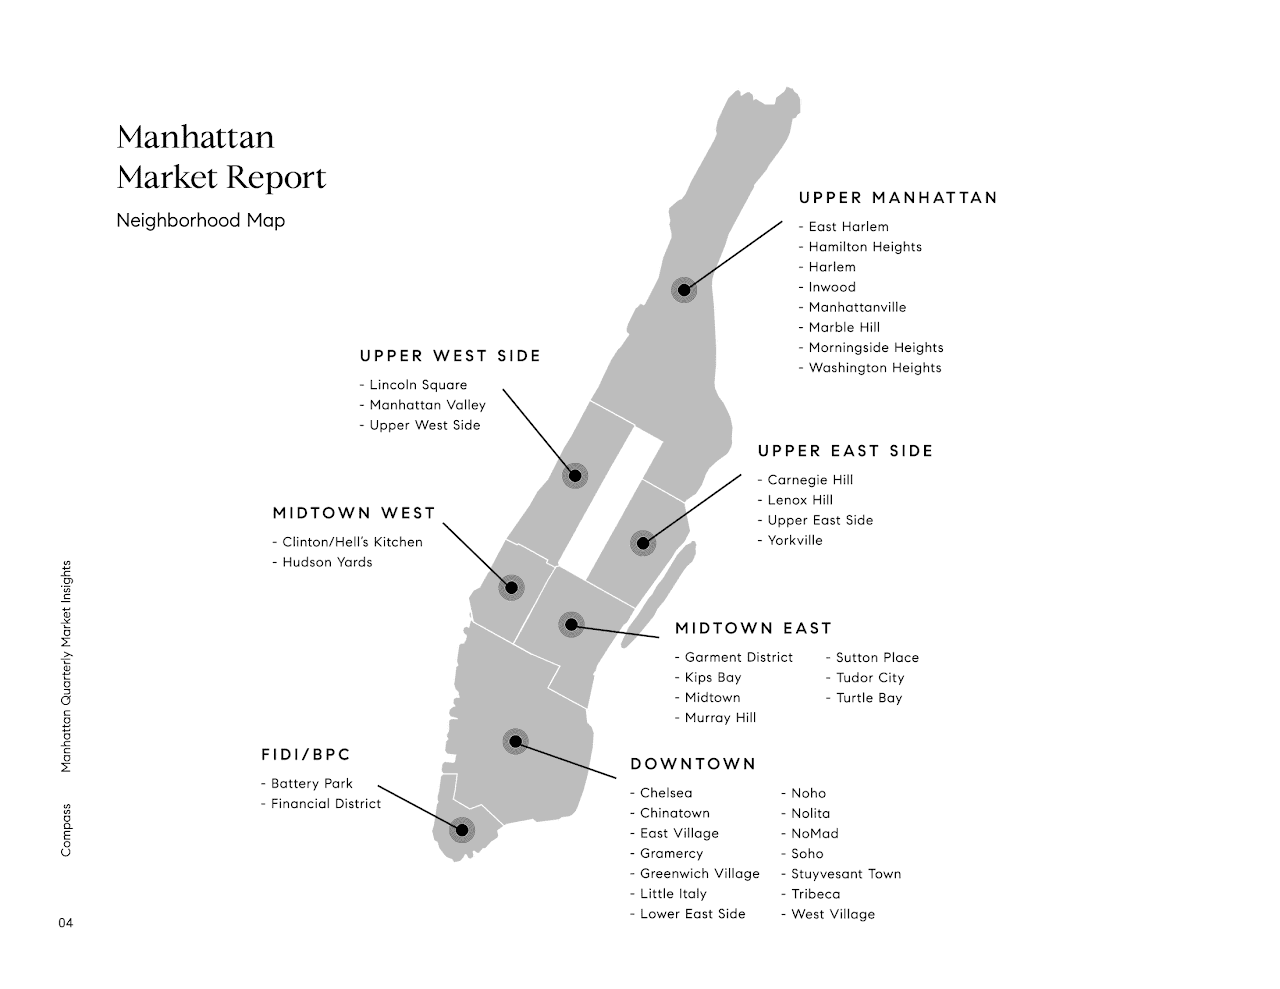
Buyers also continued to have an affinity for downtown, including TriBeCa and the West Village. Downtown had the highest average price of any submarket.
While Upper Manhattan, which encompasses Inwood and Washington Heights to Harlem and Fast Harlem, also was a preferred destination. Buyers searching for more space at more affordable prices flocked to the area, driving sales prices northward by 18 percent year-over-year.
In Midtown West, high inventory contributed to average prices falling 20 percent, but the area is likely to rebound as people return to the office.
On the luxury side, deep pandemic discounts have started to be a thing of the past, as the market begins to correct itself. underscoring the trust sellers have in their assets' long-term value.
In recent weeks, contracts signed have reached numbers not seen in many years. for instance, luxury contracts signed in February reached the highest total in six years. We expect this surge to carry on at all price points as the city's many cultural attractions safely reopen, the COVID-19 vaccines continue to be distributed, and sellers keep taking advantage of low-interest rates.
PRESIDENT, COMPASS TRI-STATE SENIOR MANAGING DIRECTOR
Rory Golod
Elizabeth Ann Stribling-Kivlan
Introduction 02
Market Highlights 05
Methodology 06
Recorded Sales 07
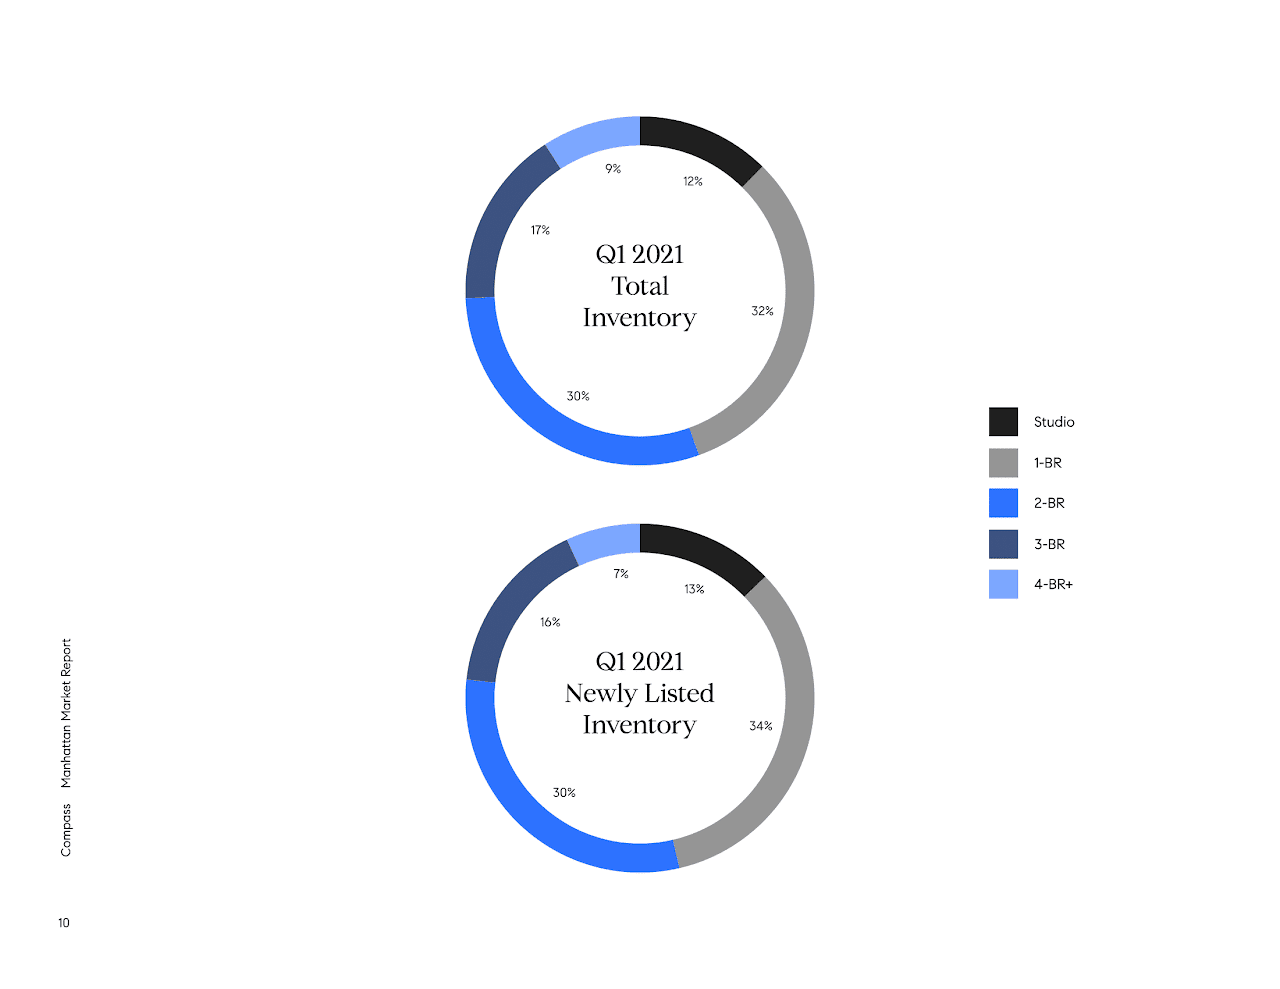
Total Inventory 10
Sales rebounded as anticipated following last quarter's contract activity, while affordability improved.

Methodology
Geography covered in this report is Manhattan.
Inventory is calculated based on all properties actively listed during the quarter at the time the report is prepared.
Contract Signed figures for the current quarter are based on publicly reported transactions at the time the report is prepared. The signed price reflects the latest available asking price.
Recorded sales figures for the quarter are based on known closings recorded at the time the report is prepared.
Median Price is the middle price of a given dataset.
Average Price is the sum of all prices divided by the total number of properties.
Months of Supply is an estimated time it would take to sell all currently active listings based on the trailing 12-month sales rate.
Time on Market is calculated by how many properties entered a contract during the quarter in the given period.
Discount is the percentage difference between the initial list and the recorded sale price.
Current Quarter is reflective of the initial day of the quarter until the 20th day of the quarter's closing month. ‘These numbers will be updated in subsequent reports to reflect the dataset of the entire quarter.
Quarters
QI: January 1 - March 31
Q2: April 1 - June 30
Q%: July 1 - September 30
Q4: October 1 - December 31
Recorded Sales
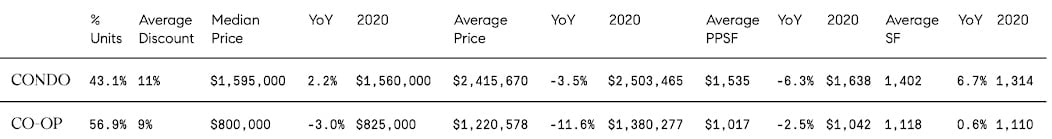
By Property Type
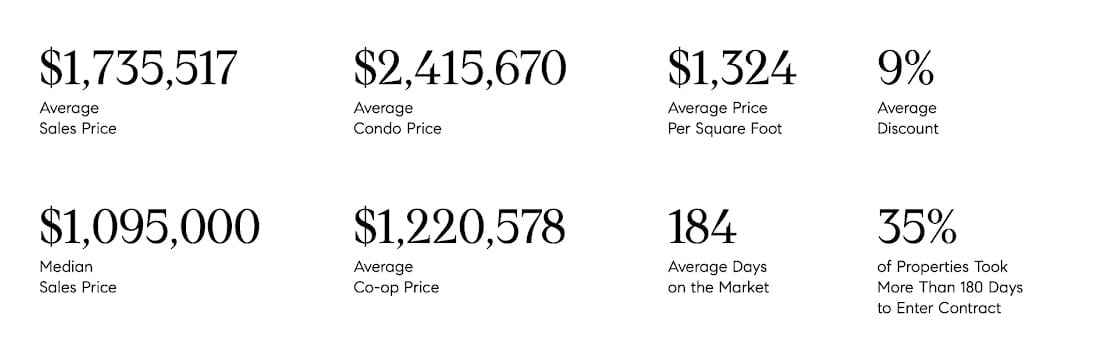
Sales rebounded significantly. climbing 48% year over year and 37% quarter-over-quarter
- The average sales price and price per square foot dropped 7% and 5% year over year respectively, while the median price climbed 2%
- Condos sold during the quarter spent slightly more time on the market compared to last quarter. up nearly 9%. though this was 5% less than this time last year
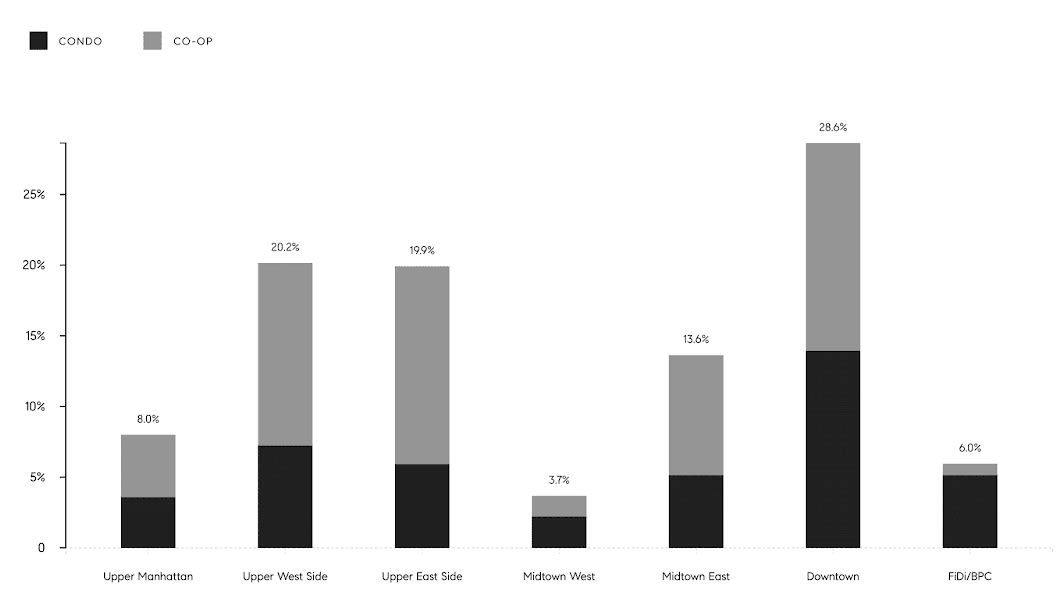
- Downtown saw the most sale, with just under 29% market share, and had the highest average price of any submarket
- The average price per square foot of co-ops fell 2.5% year-over-
- year, but climbed nearly 4.9% quarter-over-quarter
- Downtown and the Upper East Side saw the most co-op sales with
26% and 25%, respectively - Nearly 35% of co-ops sold at or above their asking price
- Co-ops saw notably lower average time on the market than condos, but
are staying on the market slightly longer year-over-year
Q1 2021 Recorded Sales
Recorded Sales
By Submarket