Manhattan Market Insights for Q3 2022

Manhattan Market Insights for Q3 2022

  • The Pucker | Heinlein Team
  • October 6, 2022

Compass Q3 2022 Manhattan Market Report cover featuring a landscaped terrace and brick fireplace.

Manhattan Q3 2022 market analysis in three columns, with sales and contract statistics and contributor names.

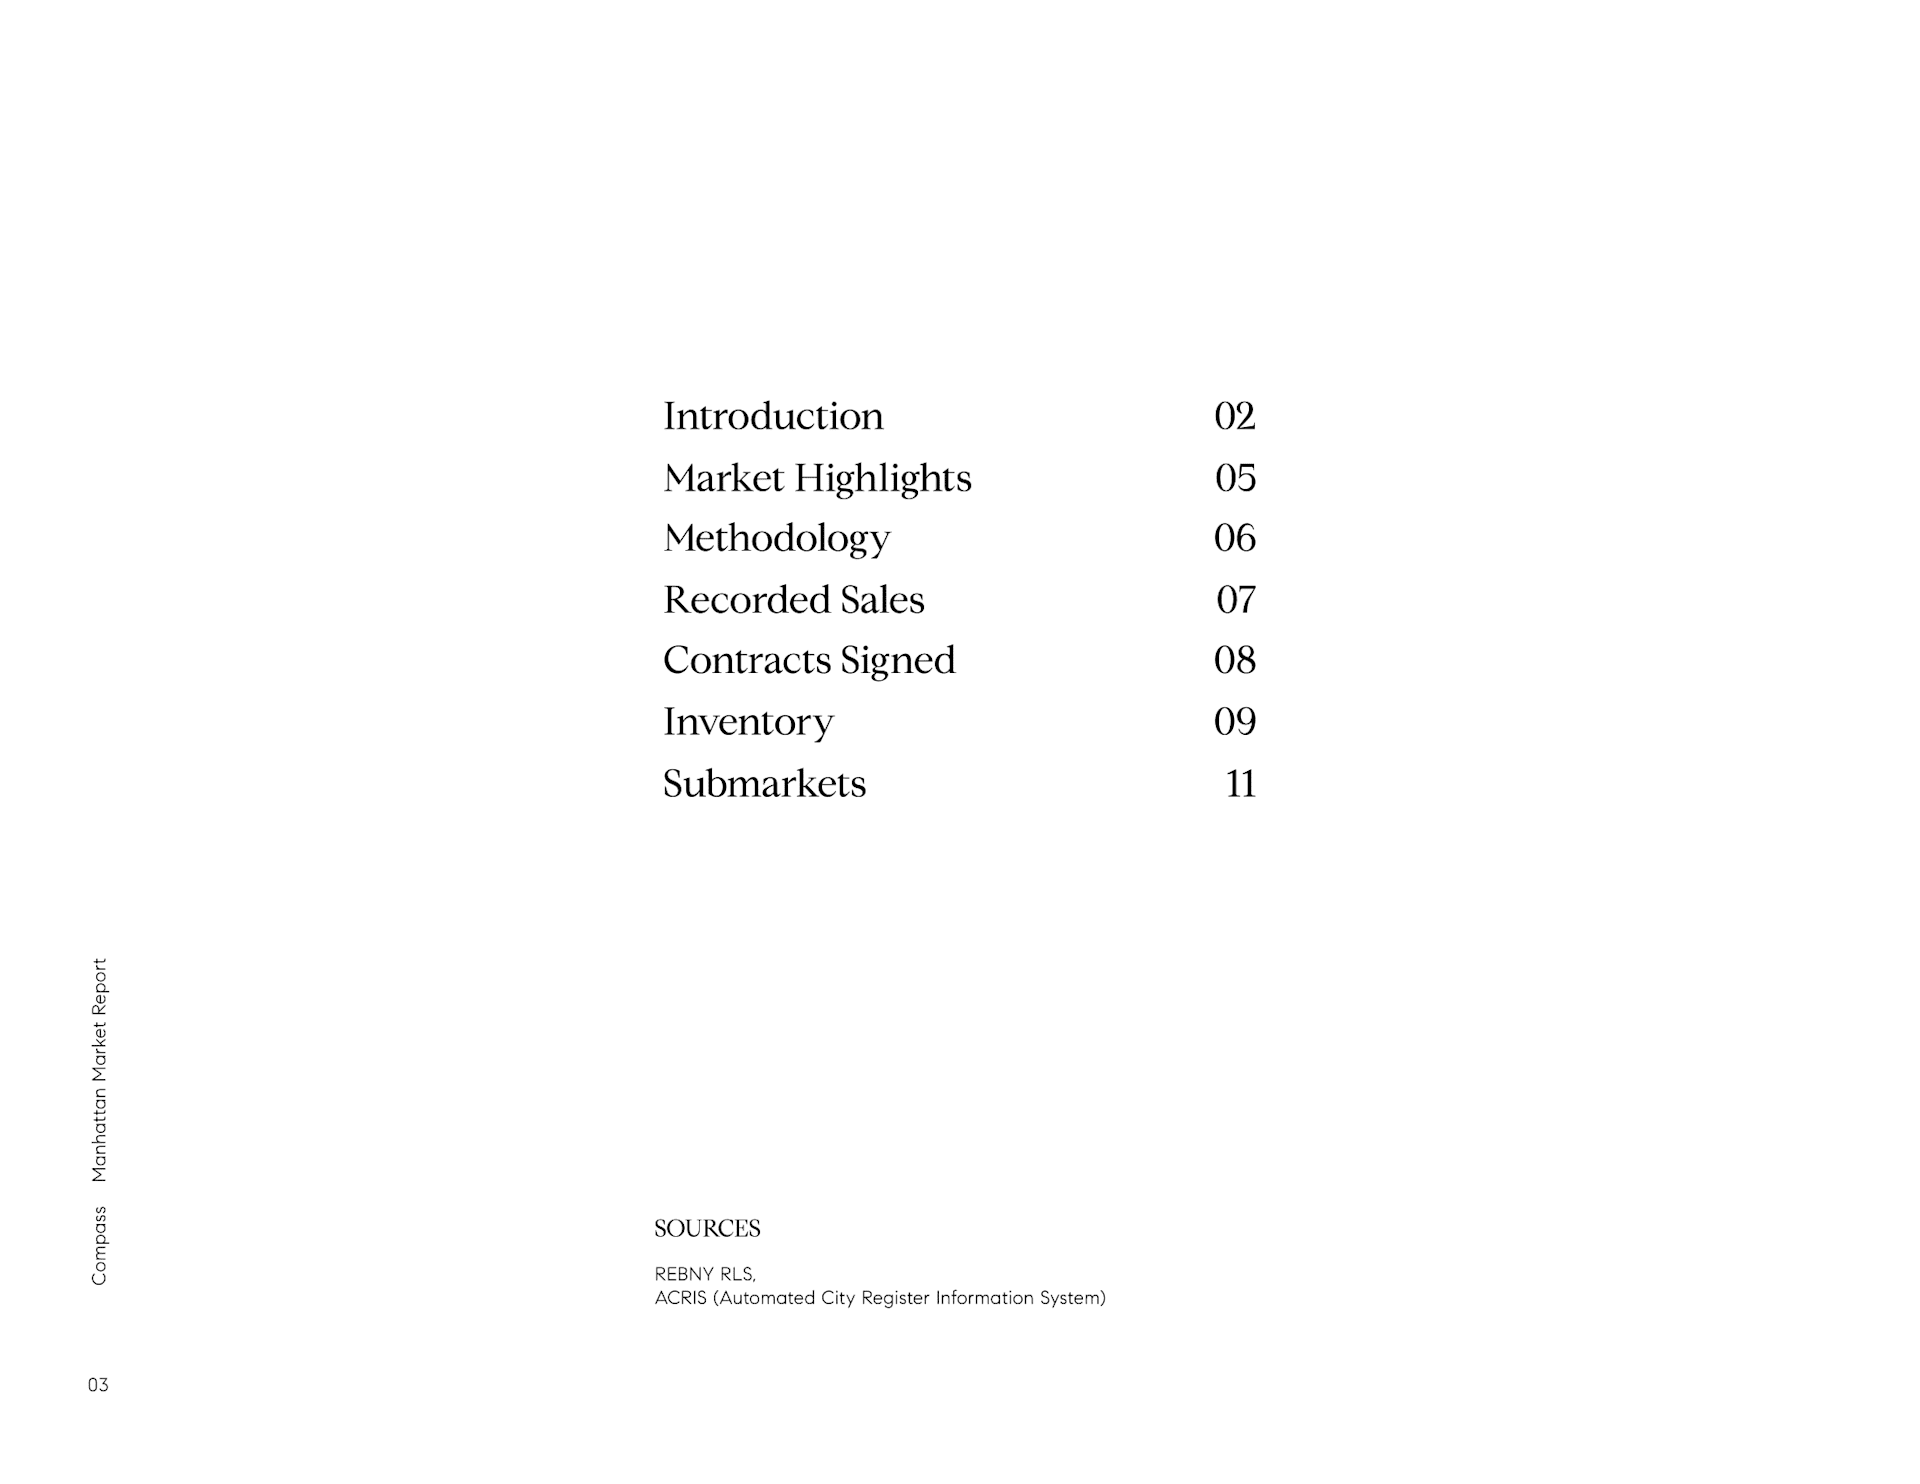
Manhattan market report contents page listing seven sections and their page numbers.

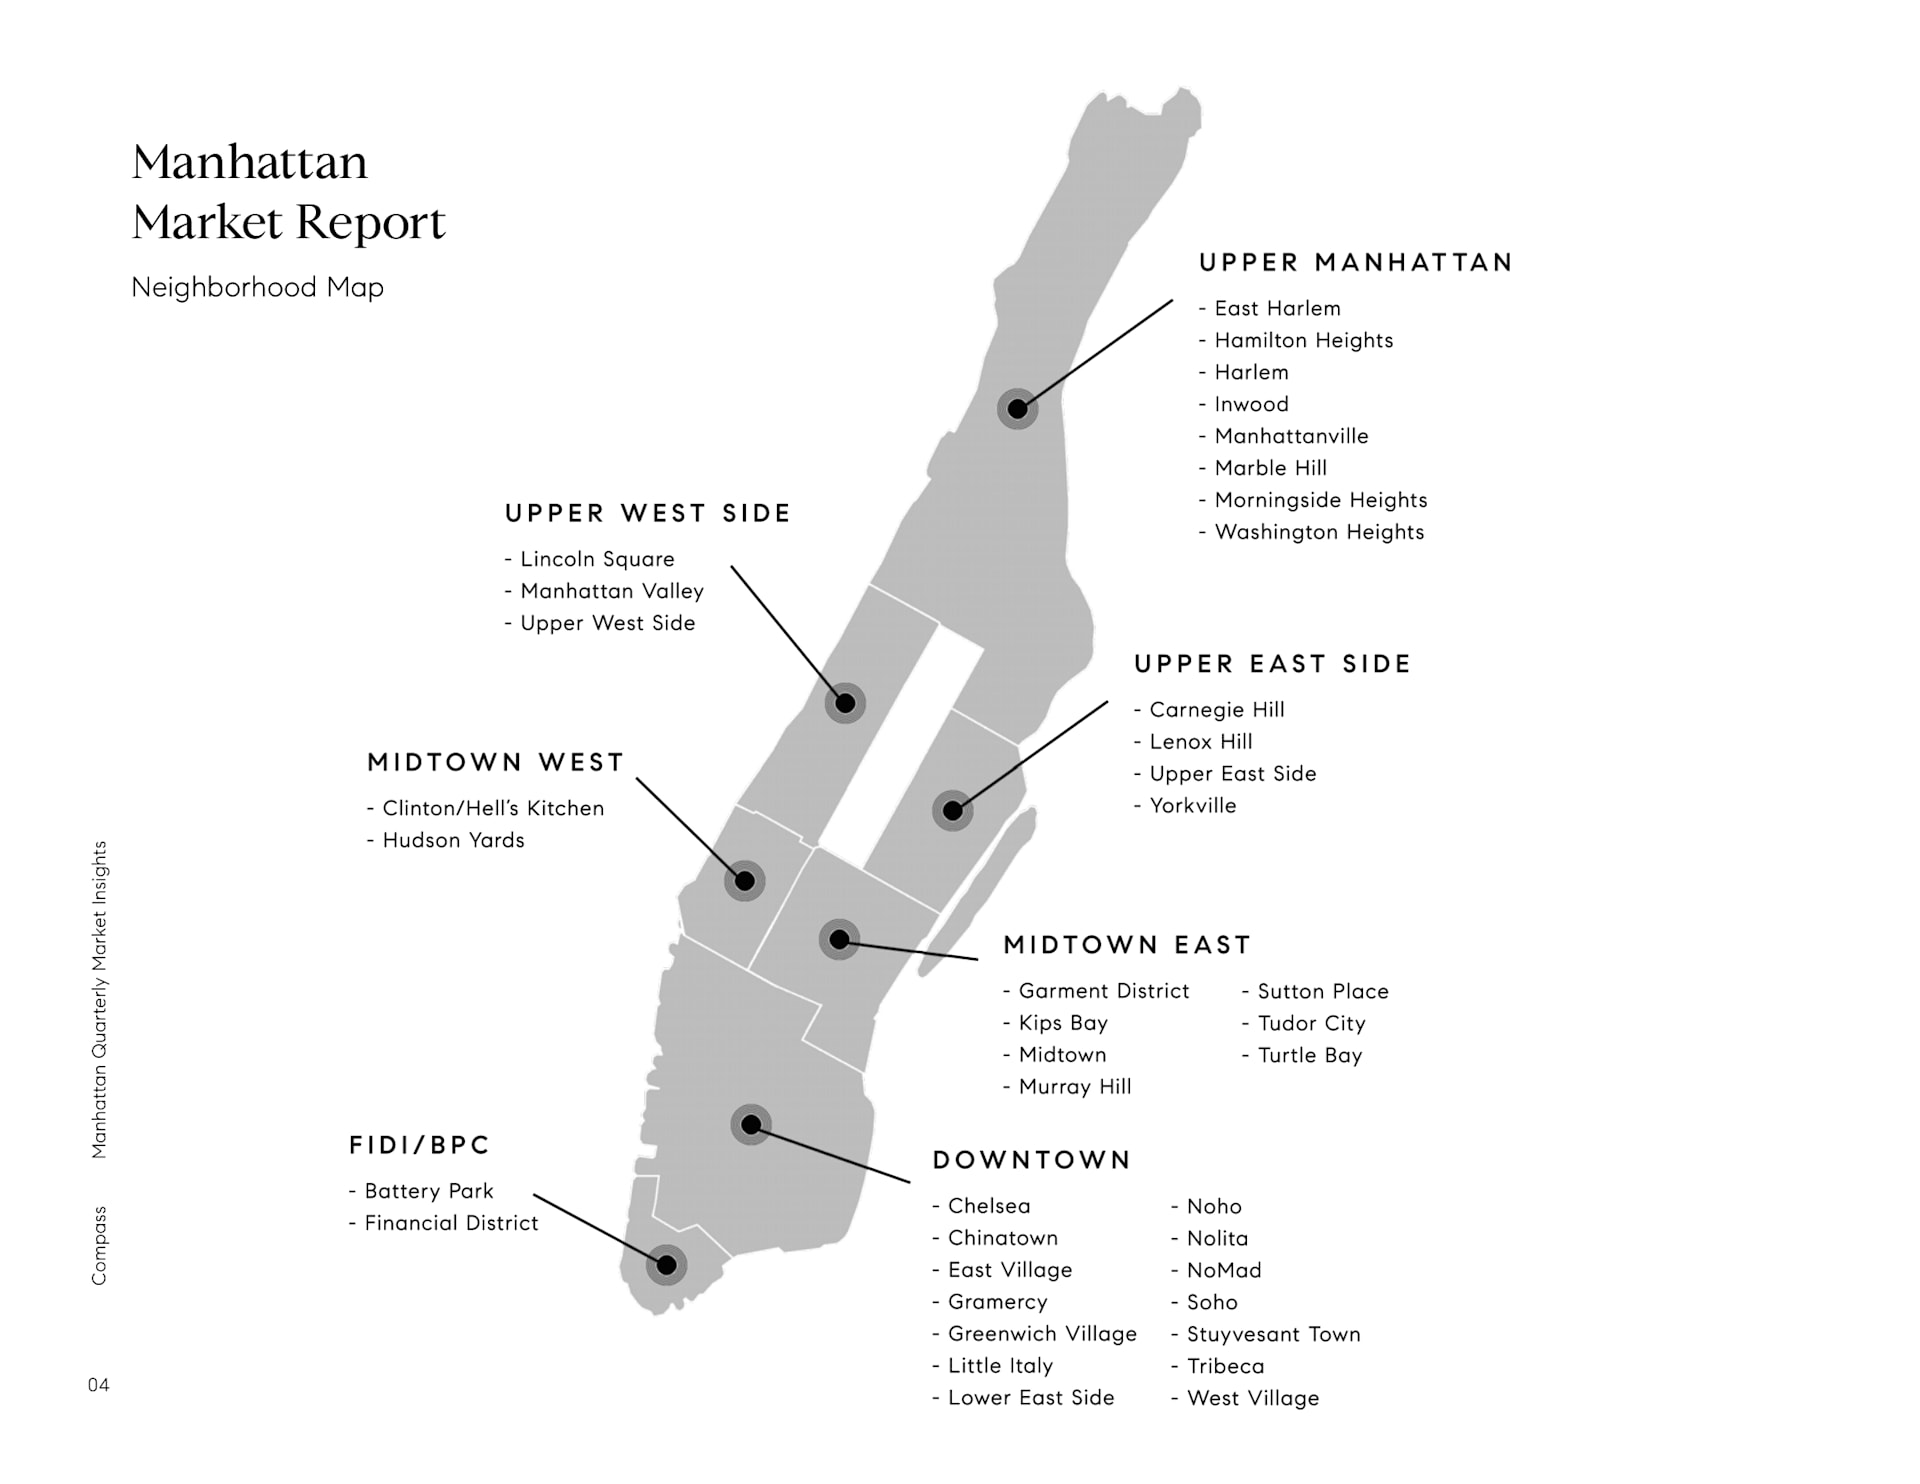
Map of Manhattan neighborhoods grouped into regions, from Upper Manhattan to Downtown.

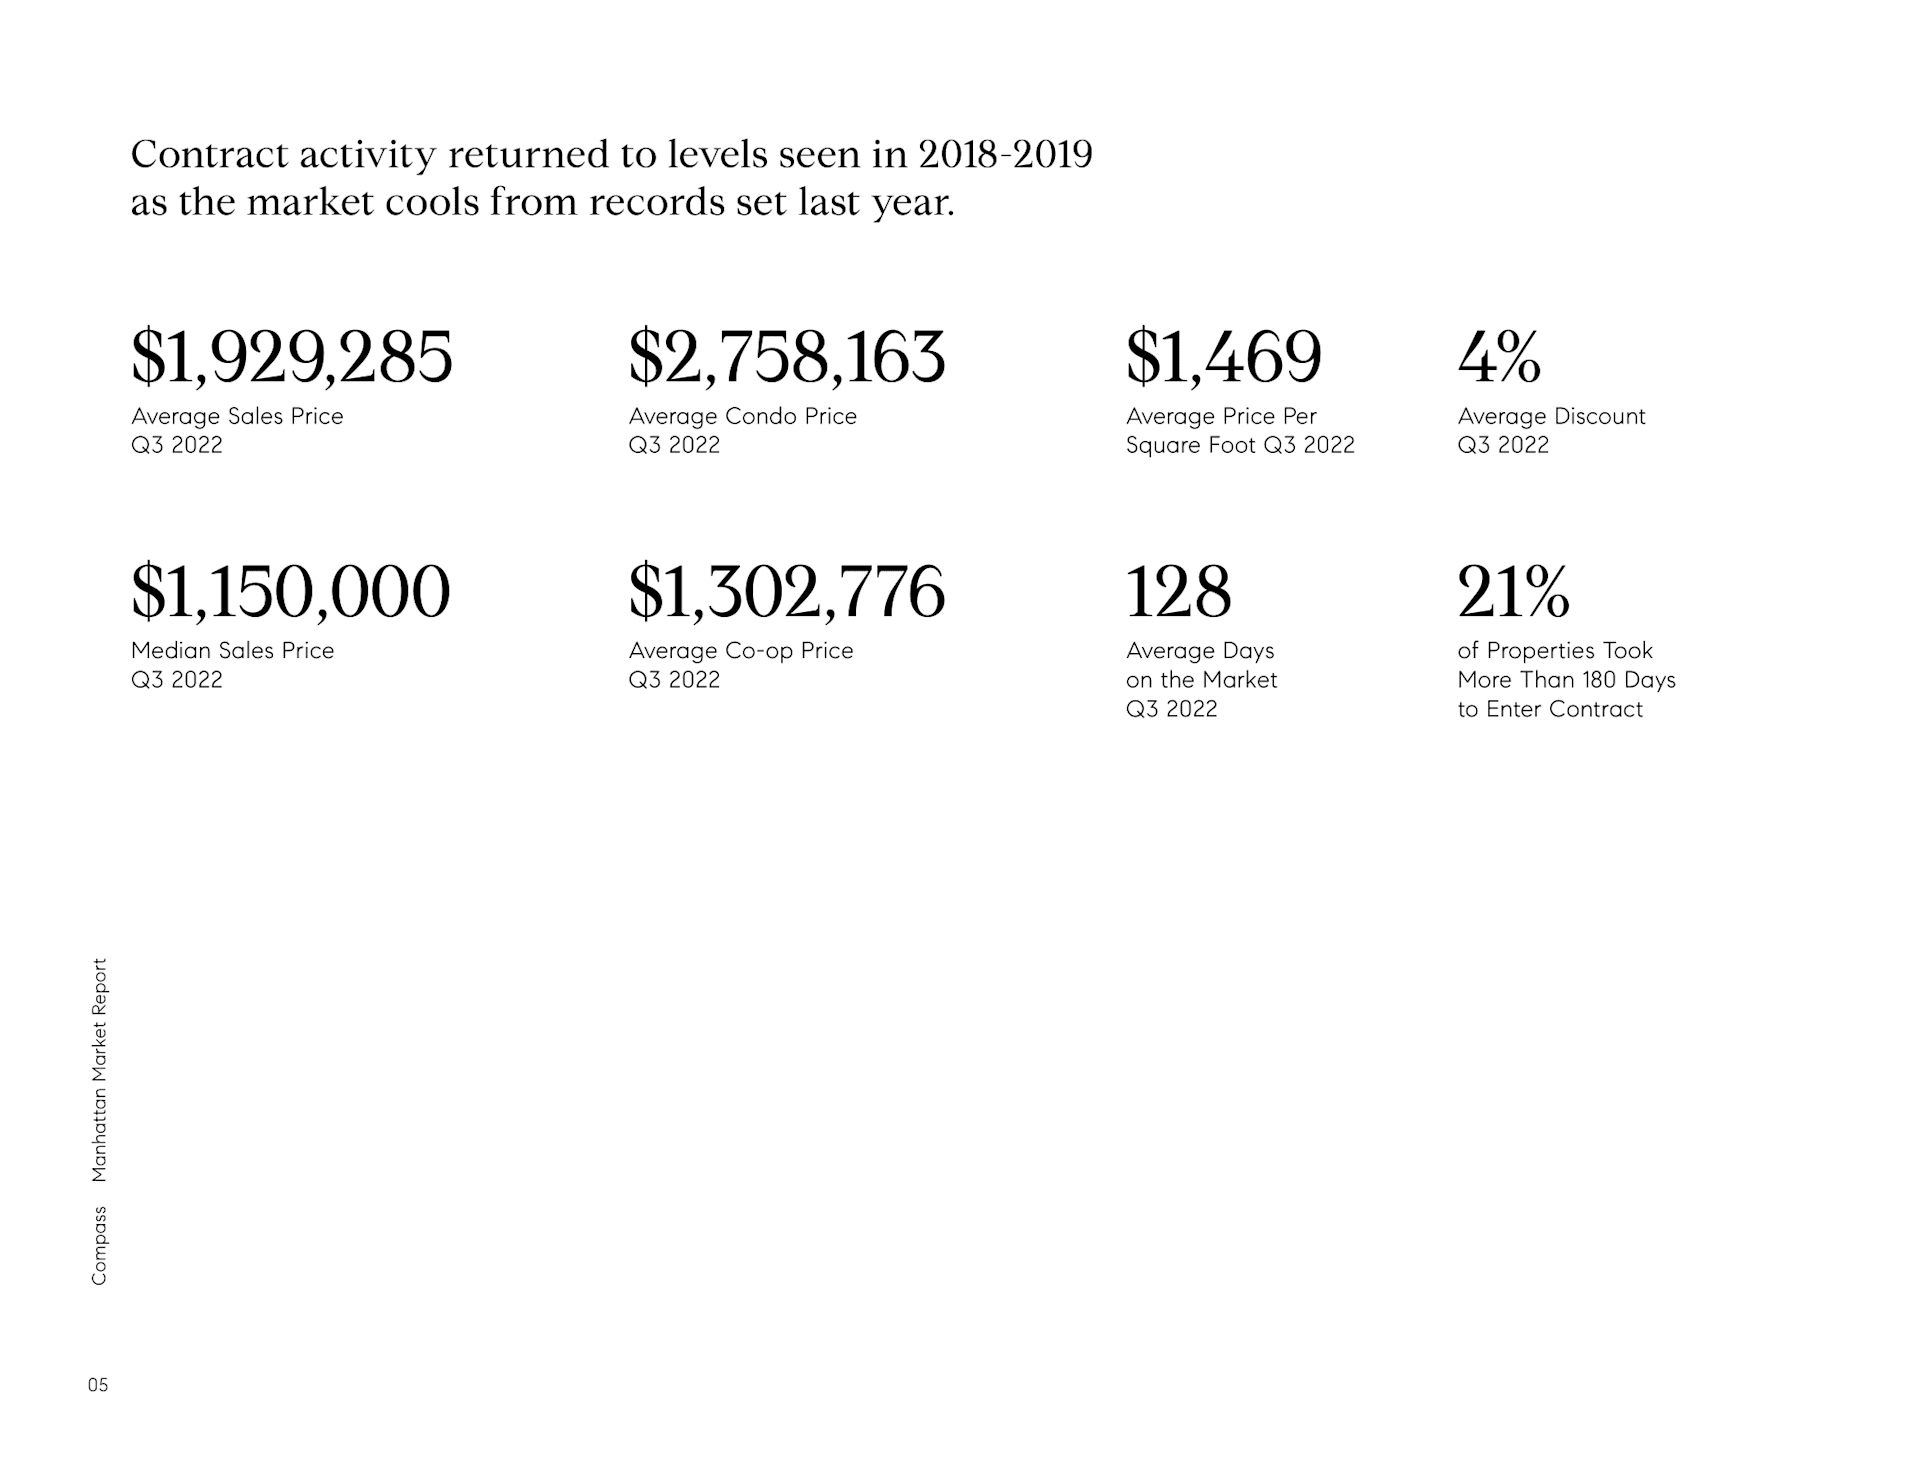
Manhattan Q3 2022 market statistics, including prices, average days on market, and contract timing.

Methodology page defining Manhattan market report statistics, data sources, calculations, and quarter date ranges.

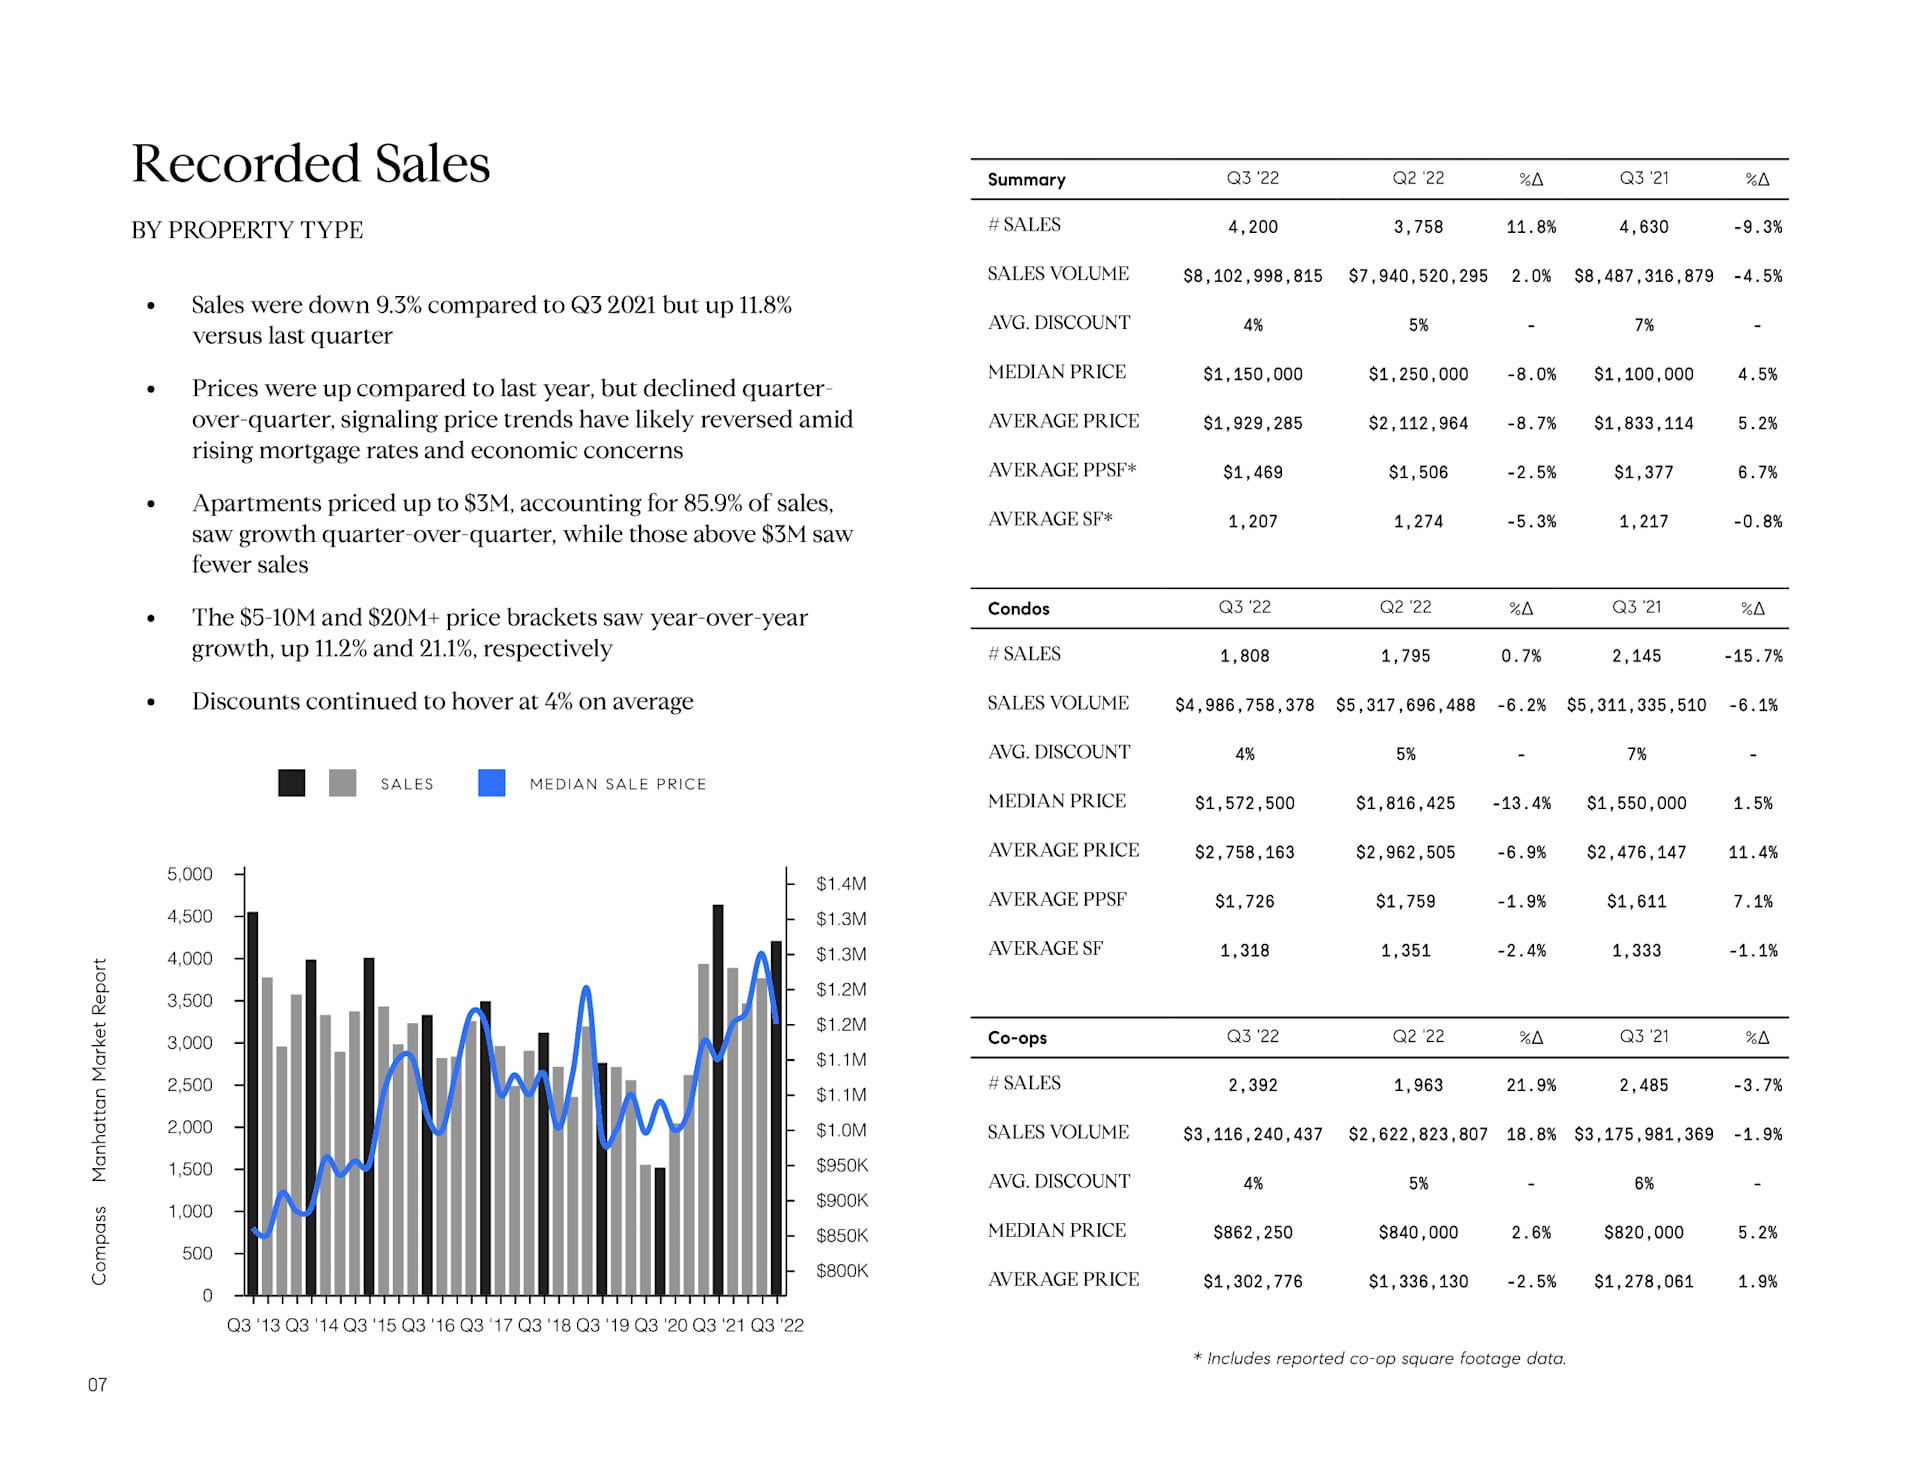
Manhattan Q3 2022 sales infographic with market commentary, a historical chart, and condo and co-op statistics.

Manhattan Q3 2022 contracts-signed infographic with market commentary, a historical chart, and property-type tables.

Manhattan Q3 2022 inventory report with market statistics and a historical inventory and price chart.


Chart comparing Manhattan Q3 2022 total and newly listed inventory by bedroom count.

Upper West Side Q3 2022 market infographic with bedroom market share, historical sales chart, and market data tables.

Upper West Side Q3 2022 market report tables comparing condo and co-op sales and median prices by bedroom count.

Upper East Side Q3 2022 market infographic with bedroom market shares and sales, contracts, and inventory data.

Upper East Side Q3 2022 market tables comparing condo and co-op sales and median prices by bedroom count.

Midtown West Q3 2022 market report with apartment-size share chart, historical bar chart, and sales, contract, and inventory tables.

Midtown West Q3 2022 market tables compare condo and co-op sales and median prices by bedroom count.

Midtown East Q3 2022 market report with apartment market-share chart and sales, contracts, and inventory statistics.

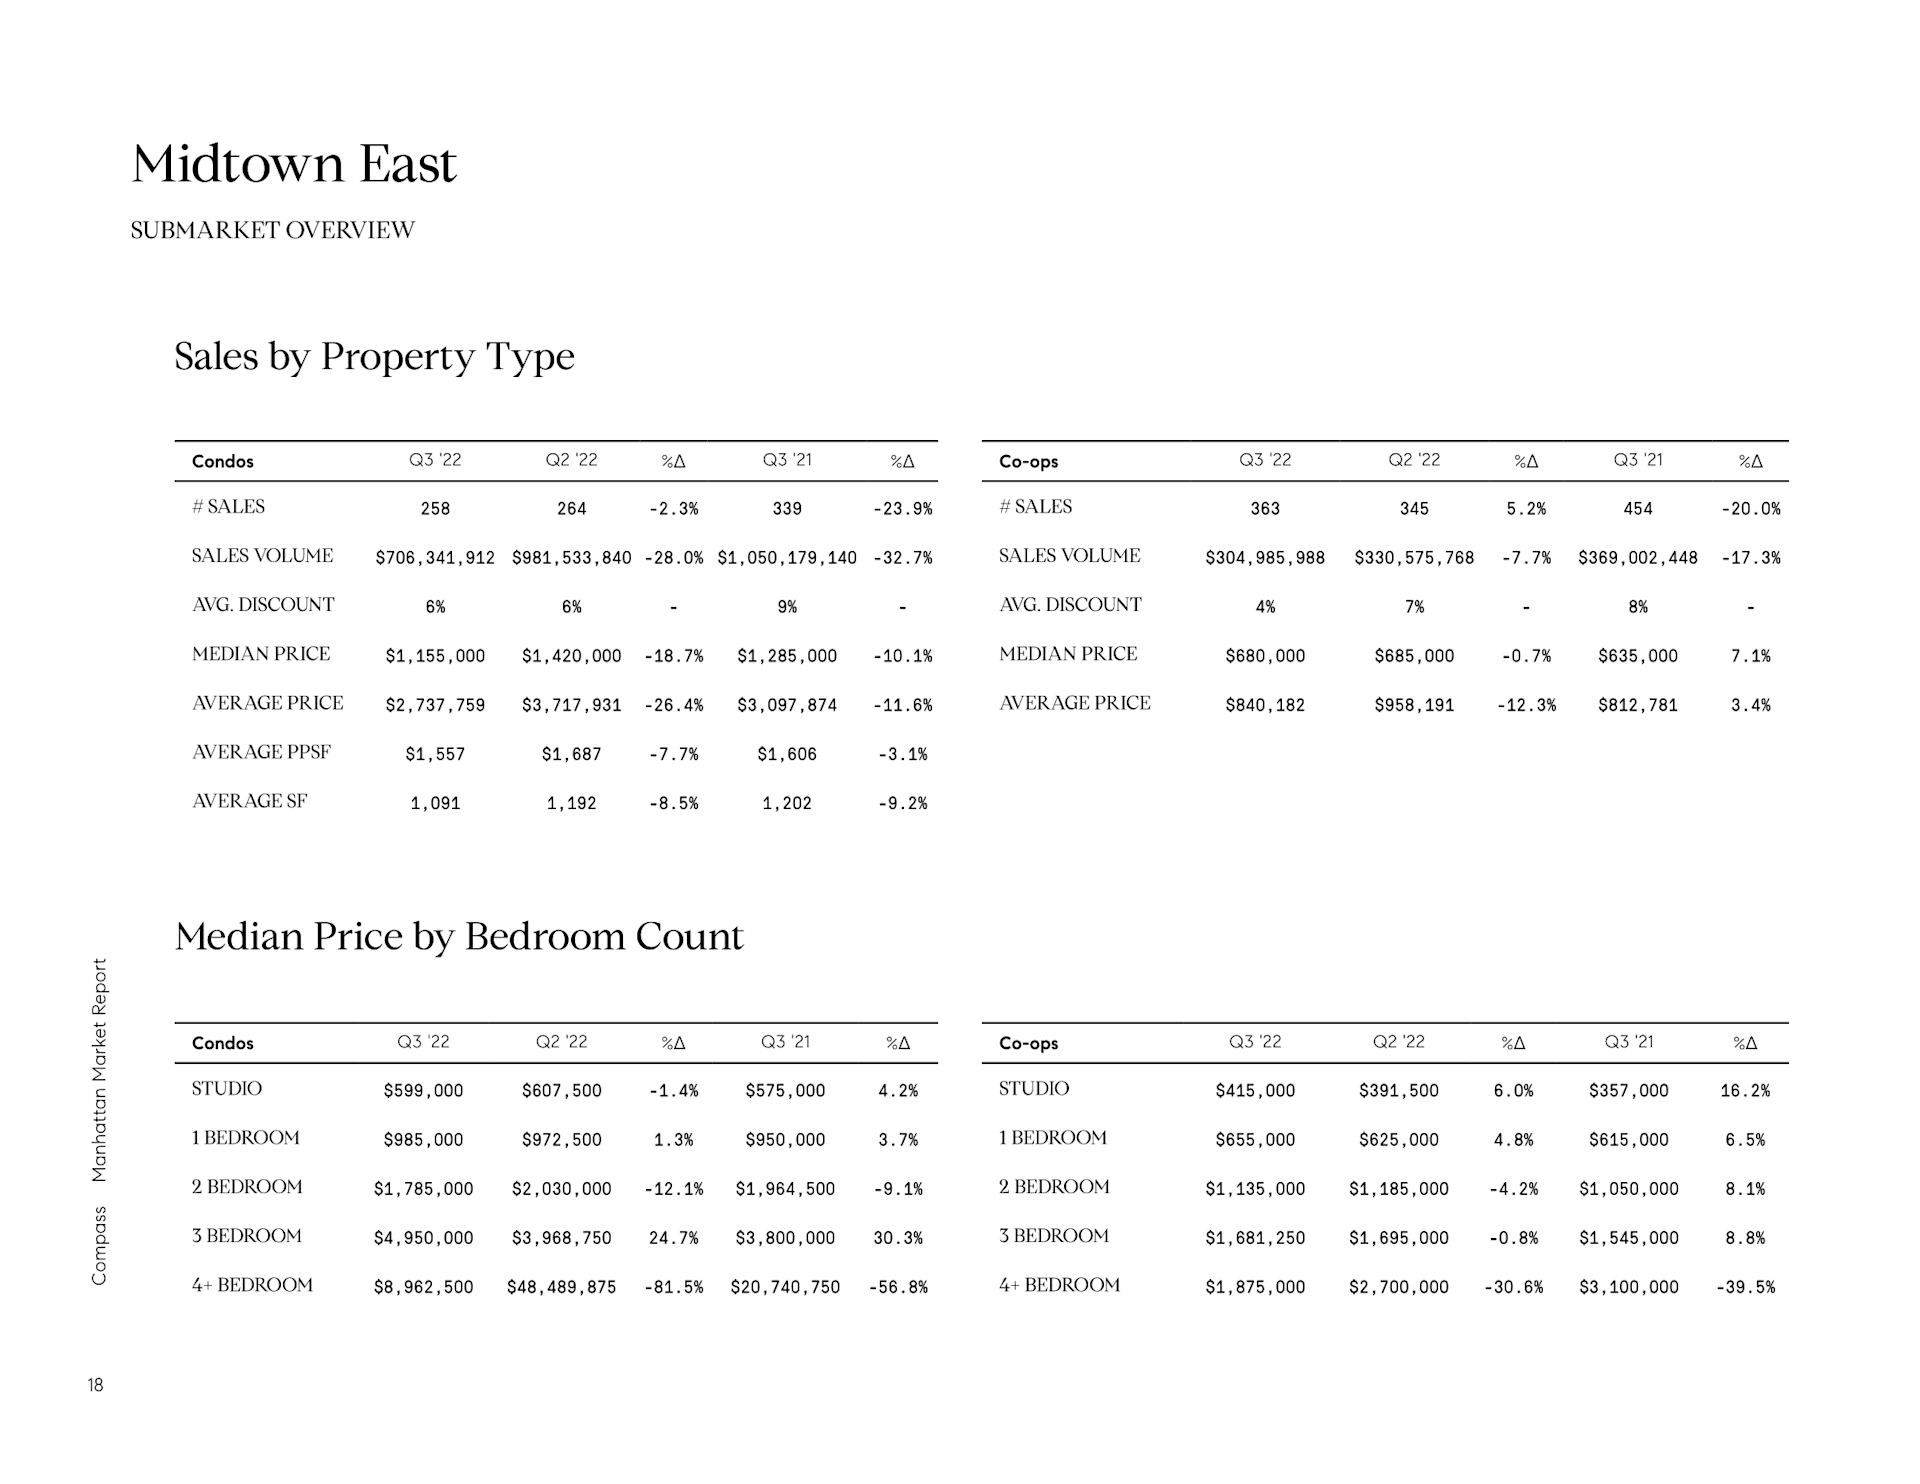
Midtown East market tables compare Q3 2022 condo and co-op sales and median prices by bedroom count.

Downtown Manhattan Q3 2022 overview with apartment-size market share chart and sales, contracts, and inventory tables.

Downtown Manhattan Q3 2022 market tables compare condo and co-op sales and median prices by bedroom count.


FiDi/BPC market report tables compare Q3 2022 sales and median prices for condos and co-ops.

Upper Manhattan Q3 2022 market report with apartment-type market share, quarterly sales chart, and sales, contract, and inventory tables.

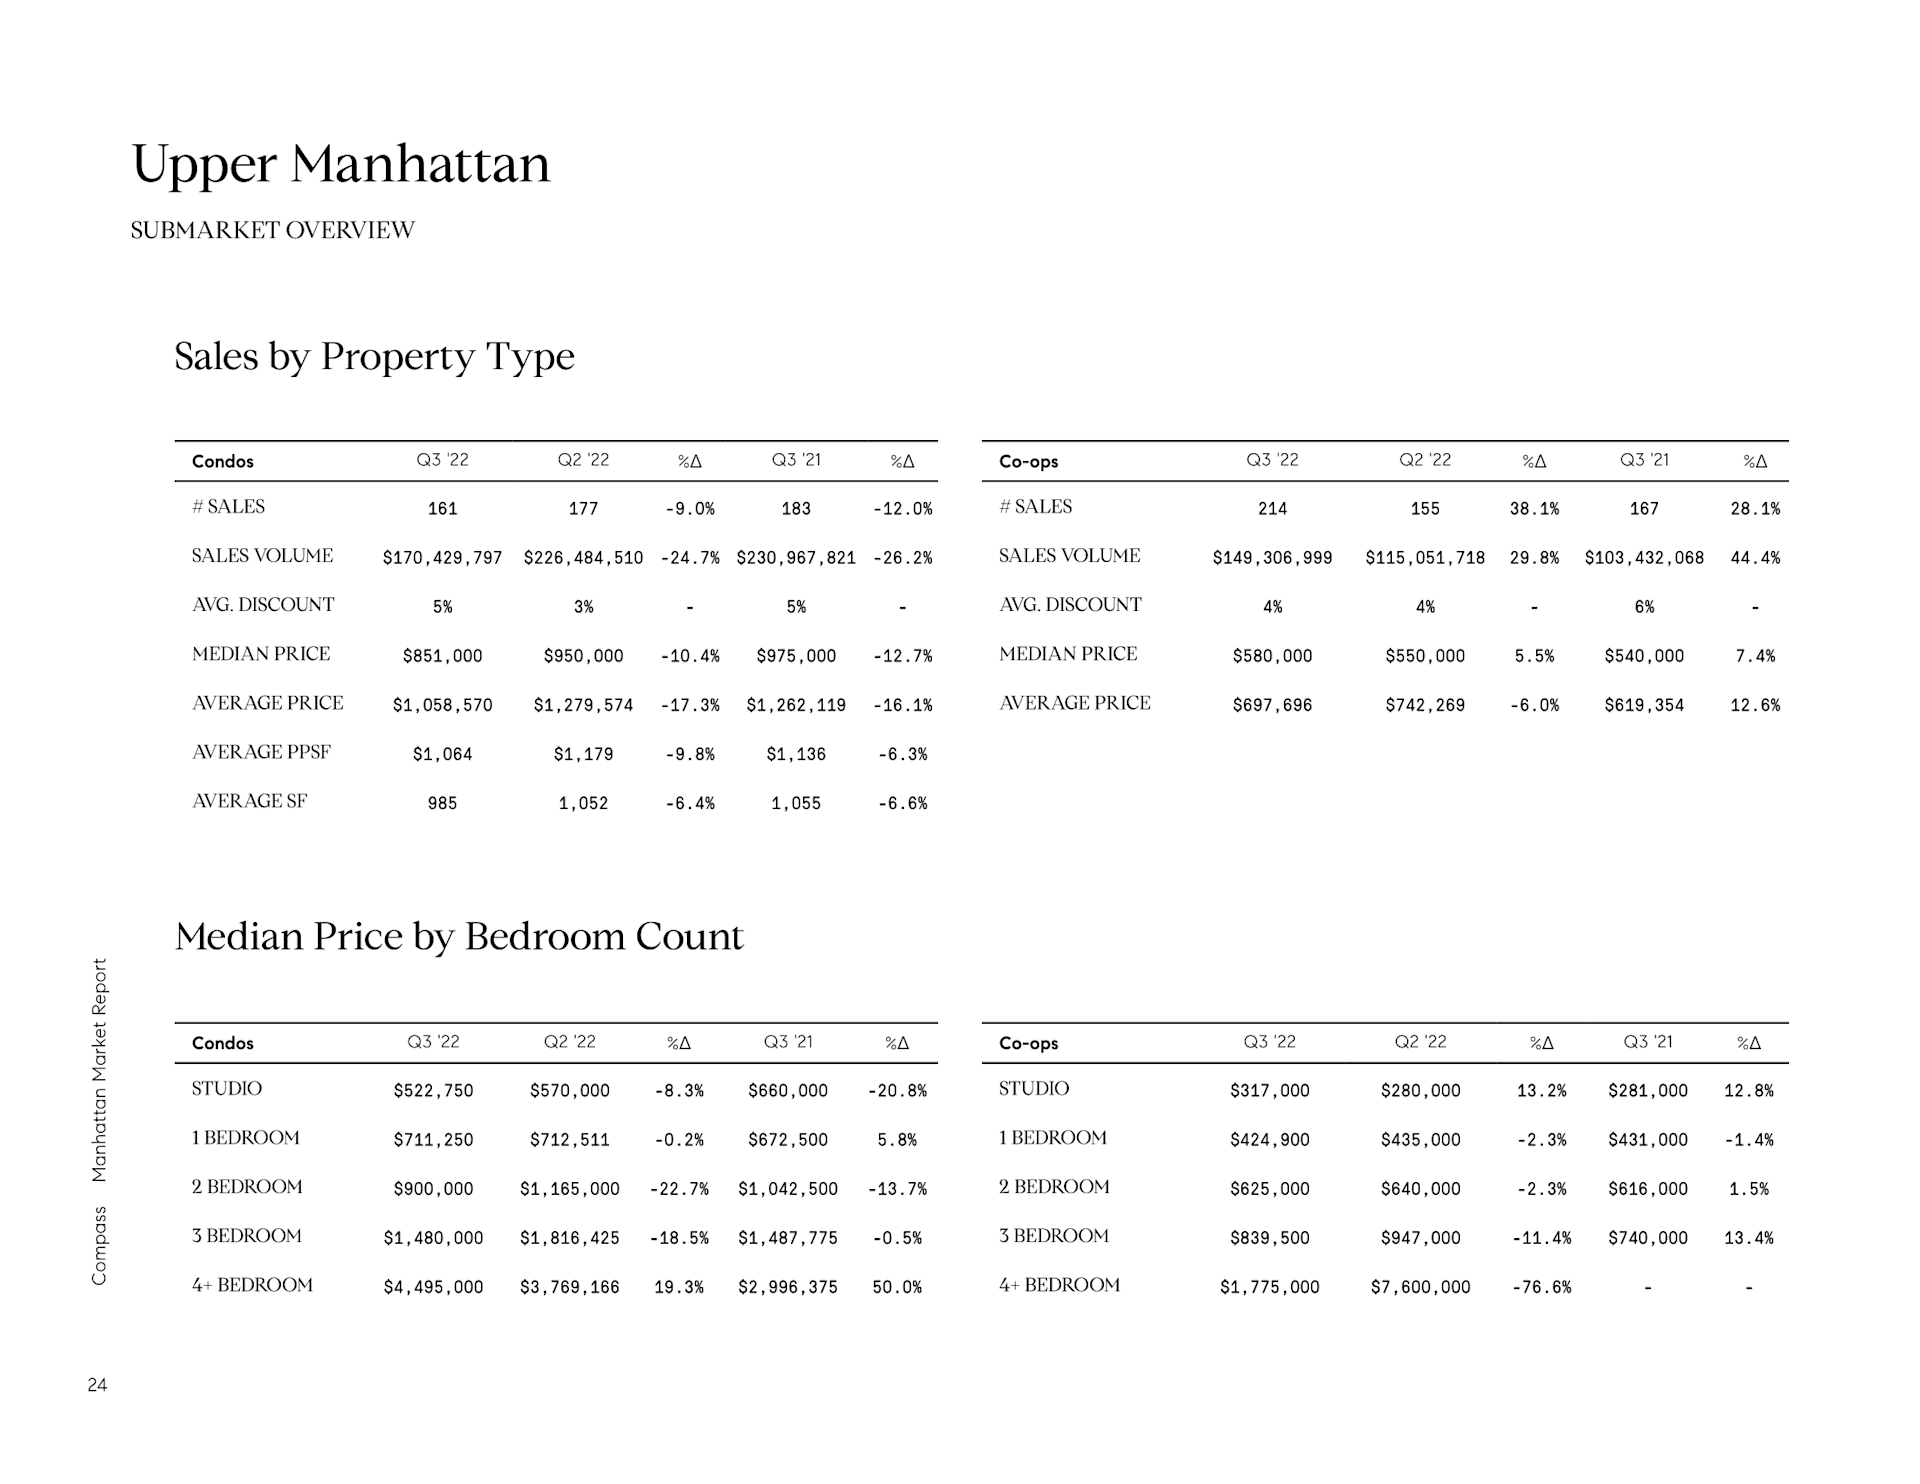
Upper Manhattan market report tables comparing condo and co-op sales and median prices by bedroom count.

Compass

Work With Us

The Pucker | Heinlein Team consults and services individual buyers, sellers, real estate investors and developers across the city and offers partnerships throughout the country to service clients’ real estate needs.

Follow Us On Instagram