Museum atrium with sculptural, cave-like walls, arched openings, and a large windowed entrance.

Manhattan Market Insights for Q3 2025

  • The Pucker | Heinlein Team
  • October 3, 2025

Cover of Compass’s Q3 2025 Manhattan Market Report, featuring an elegant living room with classical columns.

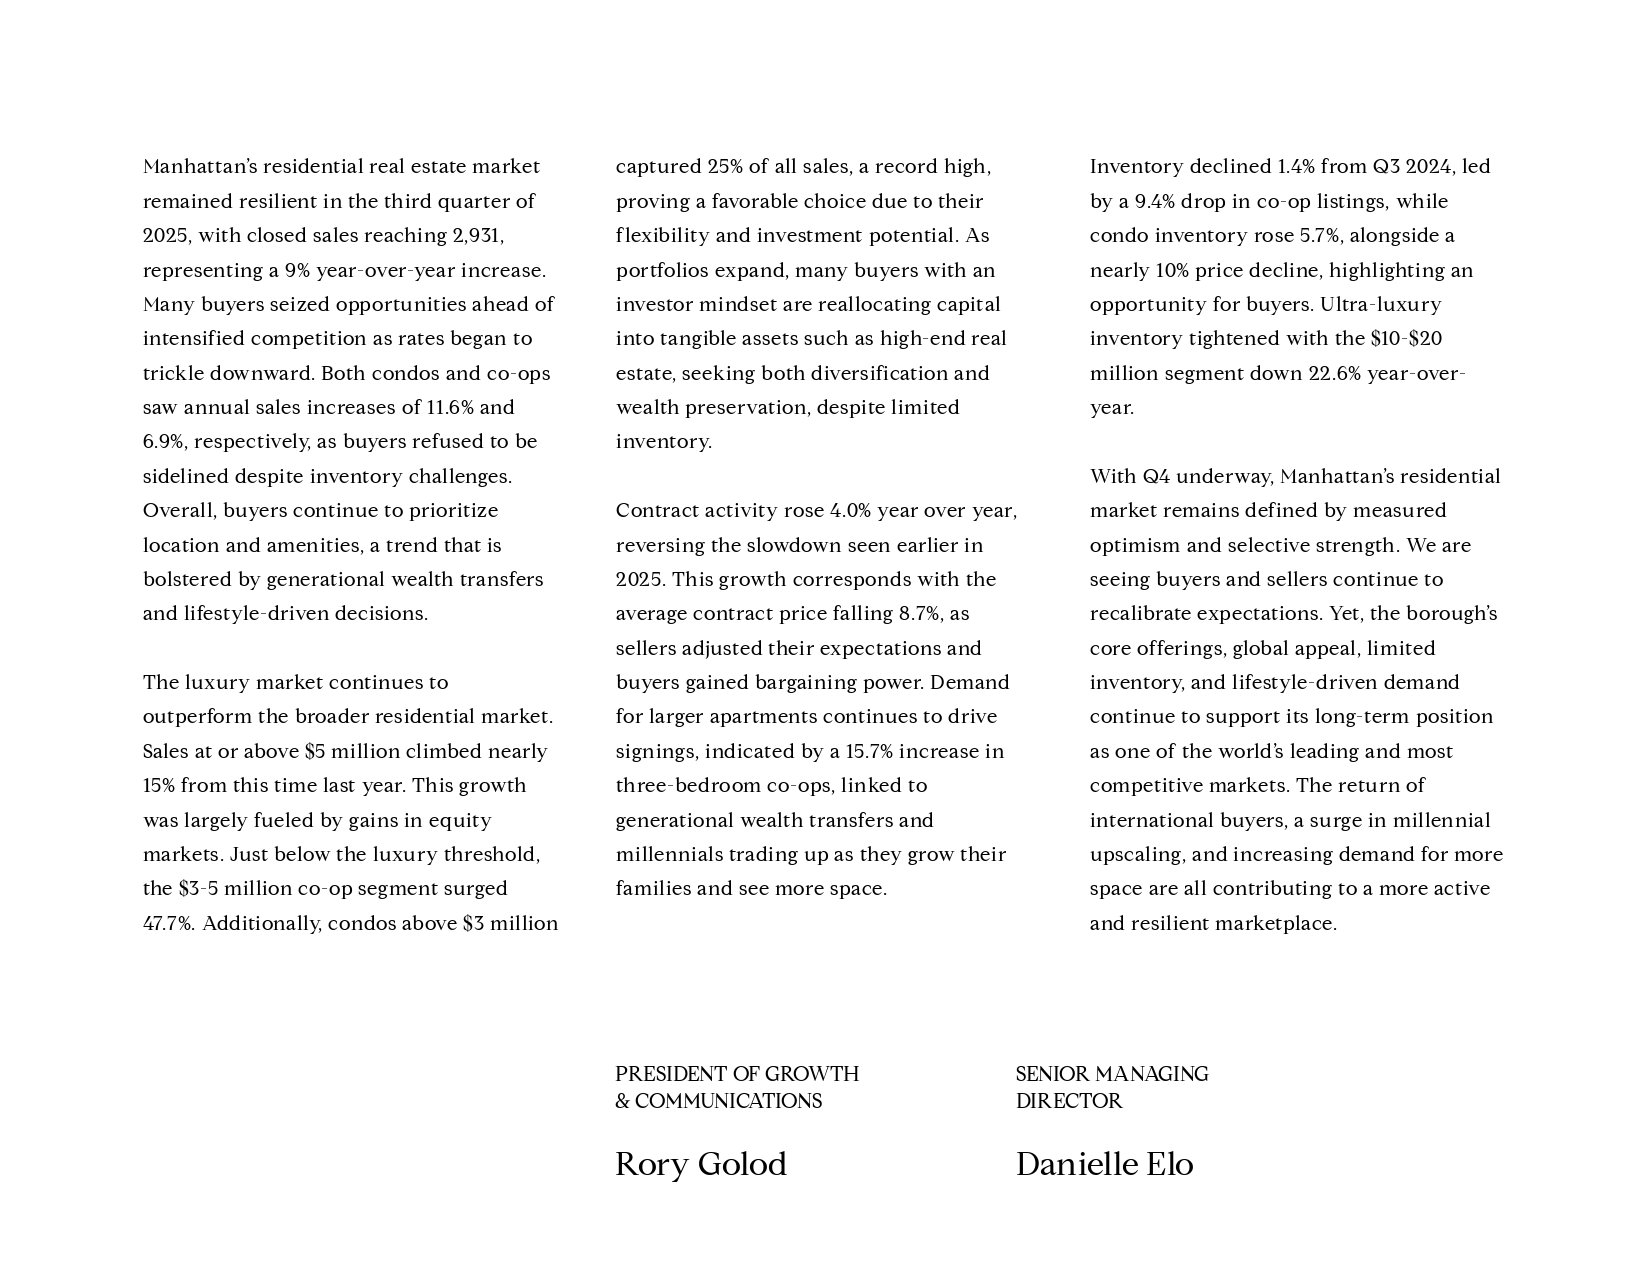
Manhattan Q3 2025 market analysis reports increased sales, luxury-market strength, changing inventory, and cautious optimism.

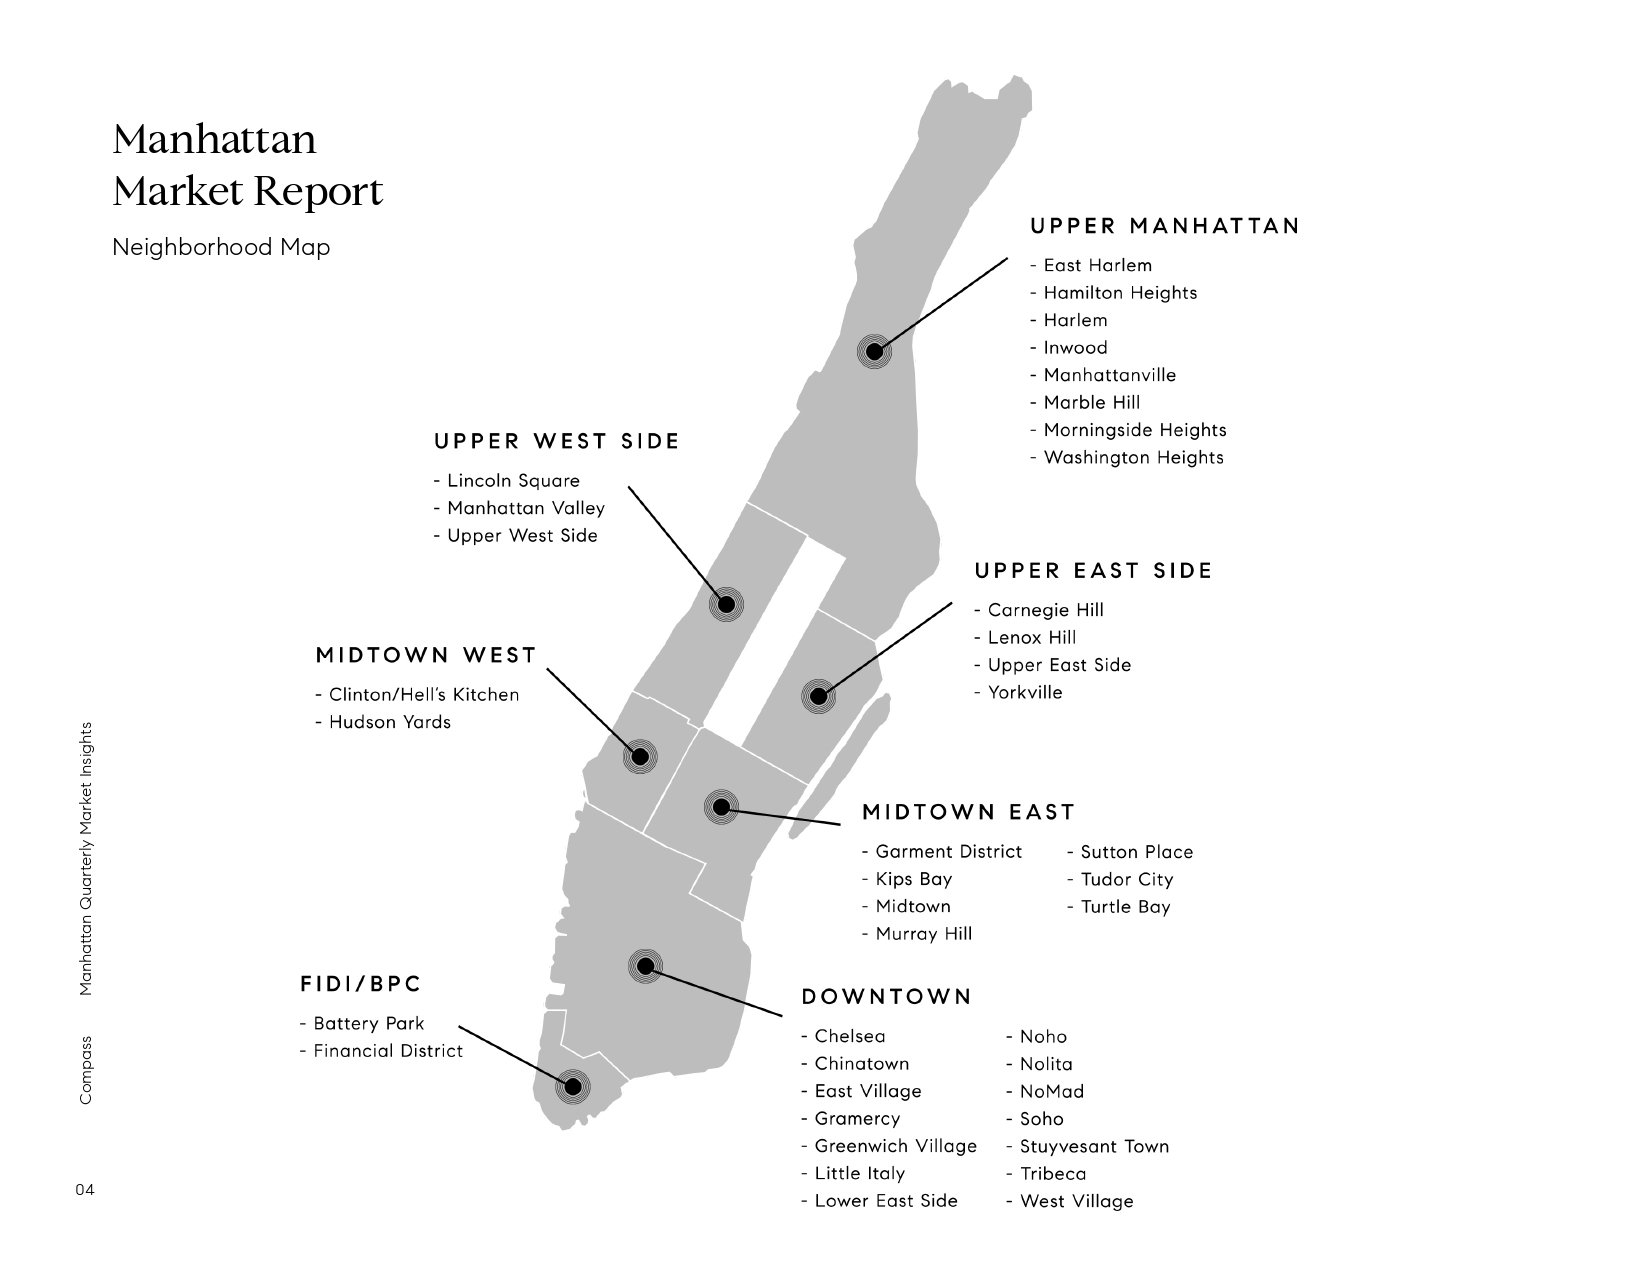
Map of Manhattan neighborhoods grouped into Upper Manhattan, the Upper West and East Sides, Midtown, Downtown, and FIDI/BPC.

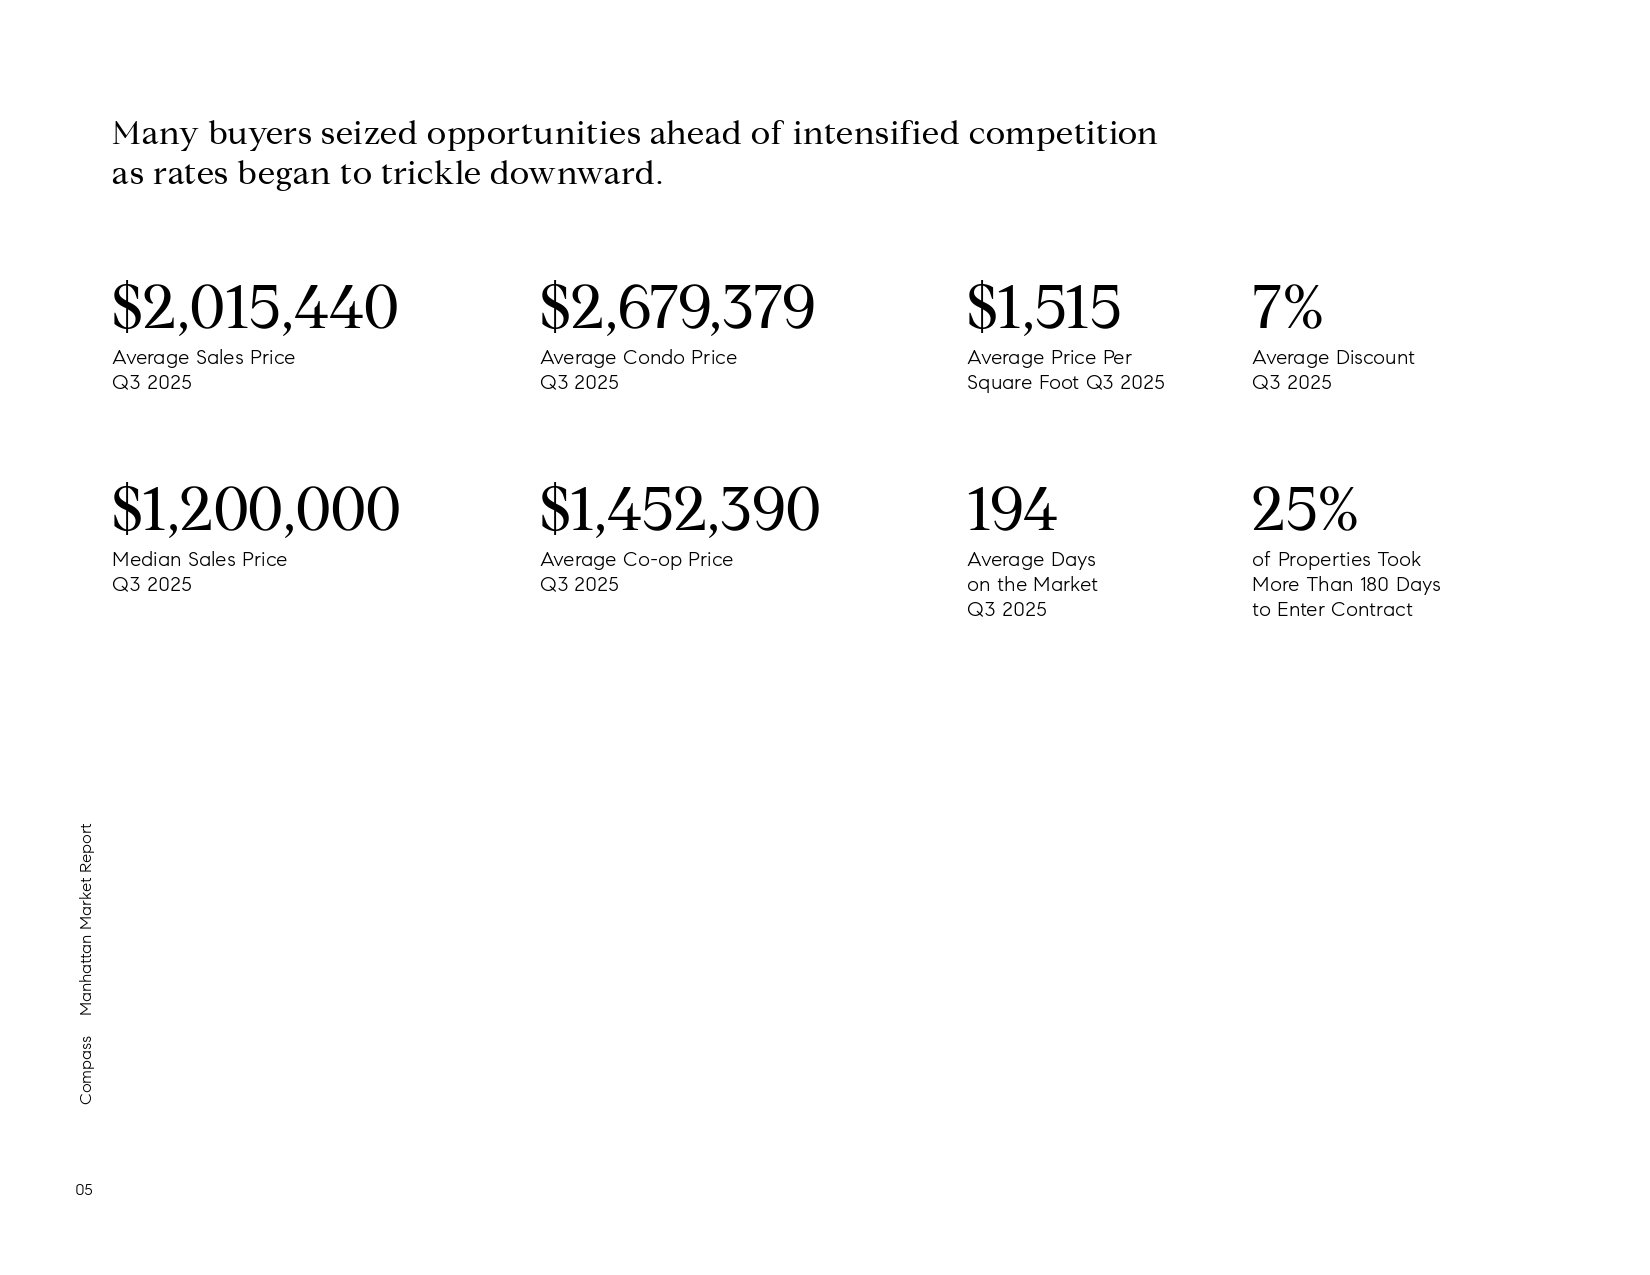
Manhattan Q3 2025 market infographic with sale prices, discounts, and days-on-market statistics.

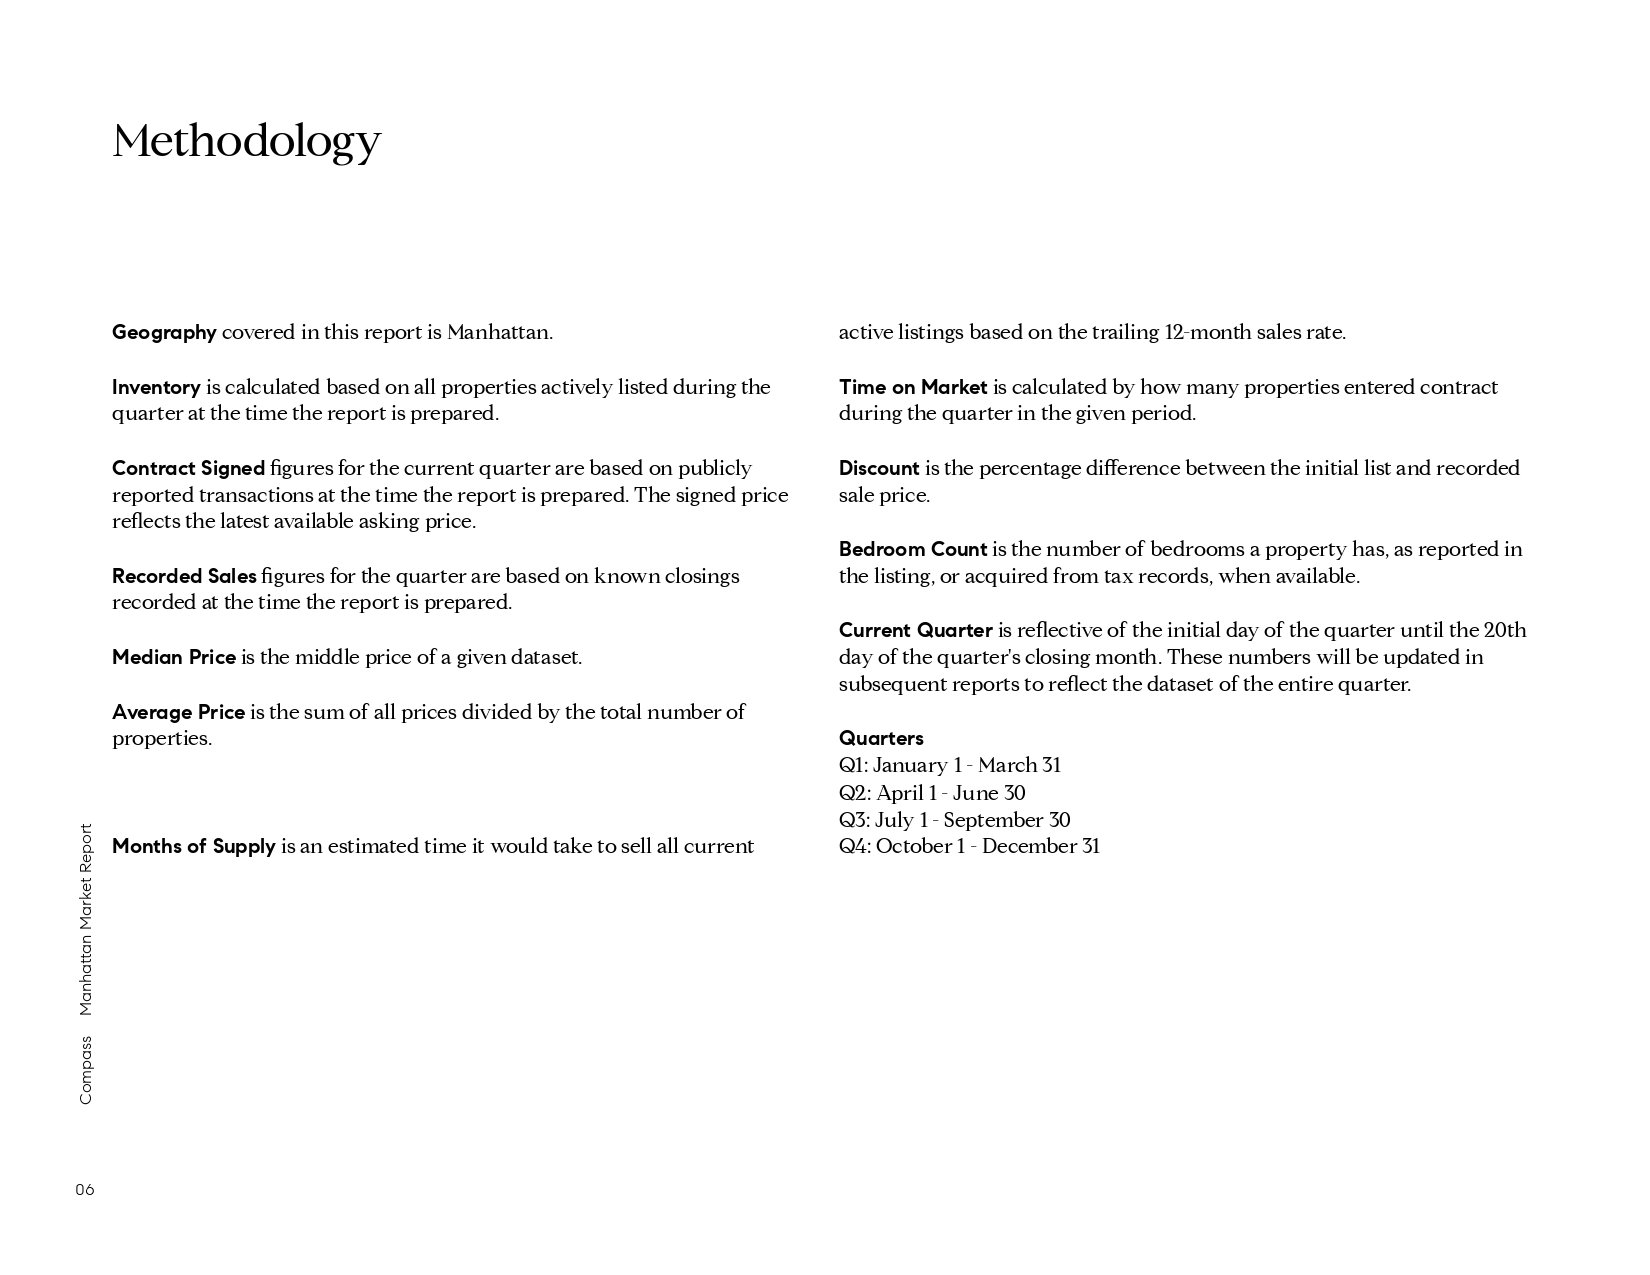
Methodology page defining Manhattan market report terms and listing quarter date ranges.

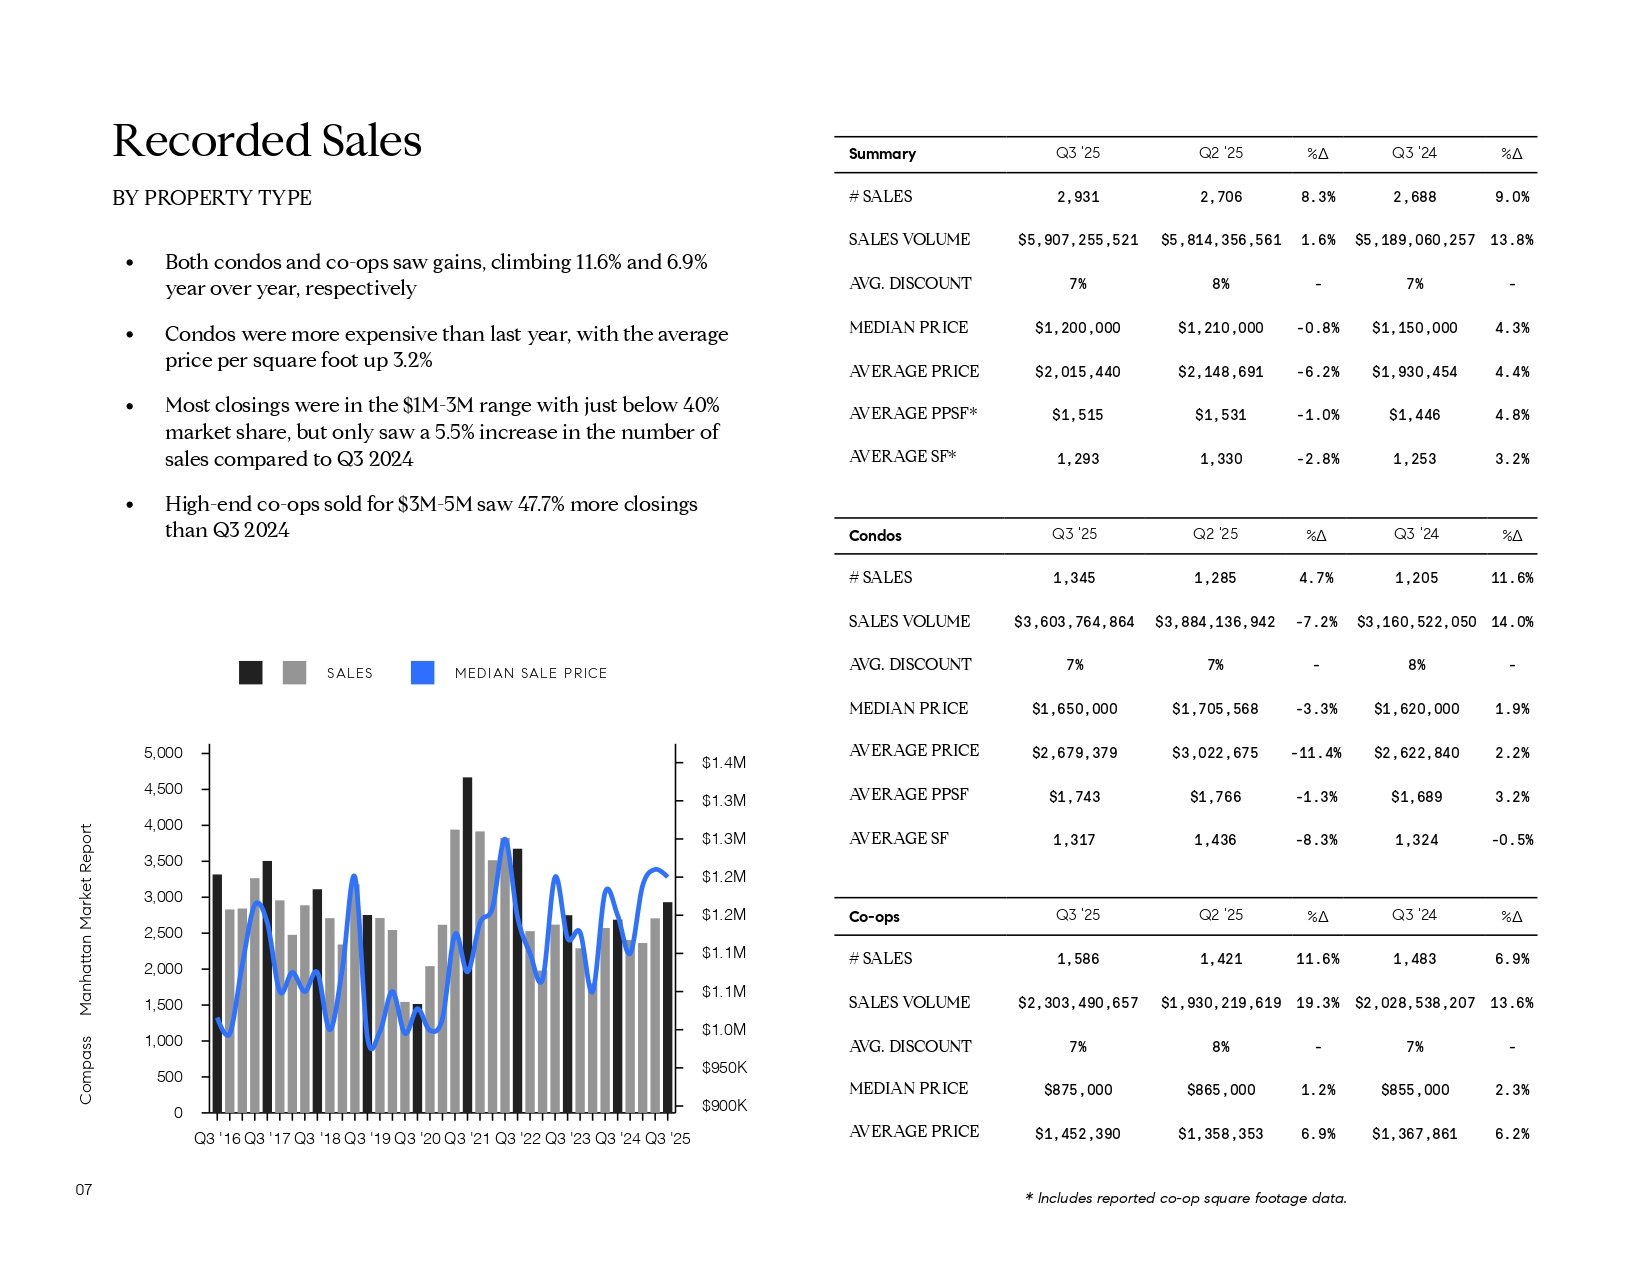
Manhattan Q3 2025 recorded-sales infographic with condo and co-op findings, chart, and comparison tables.

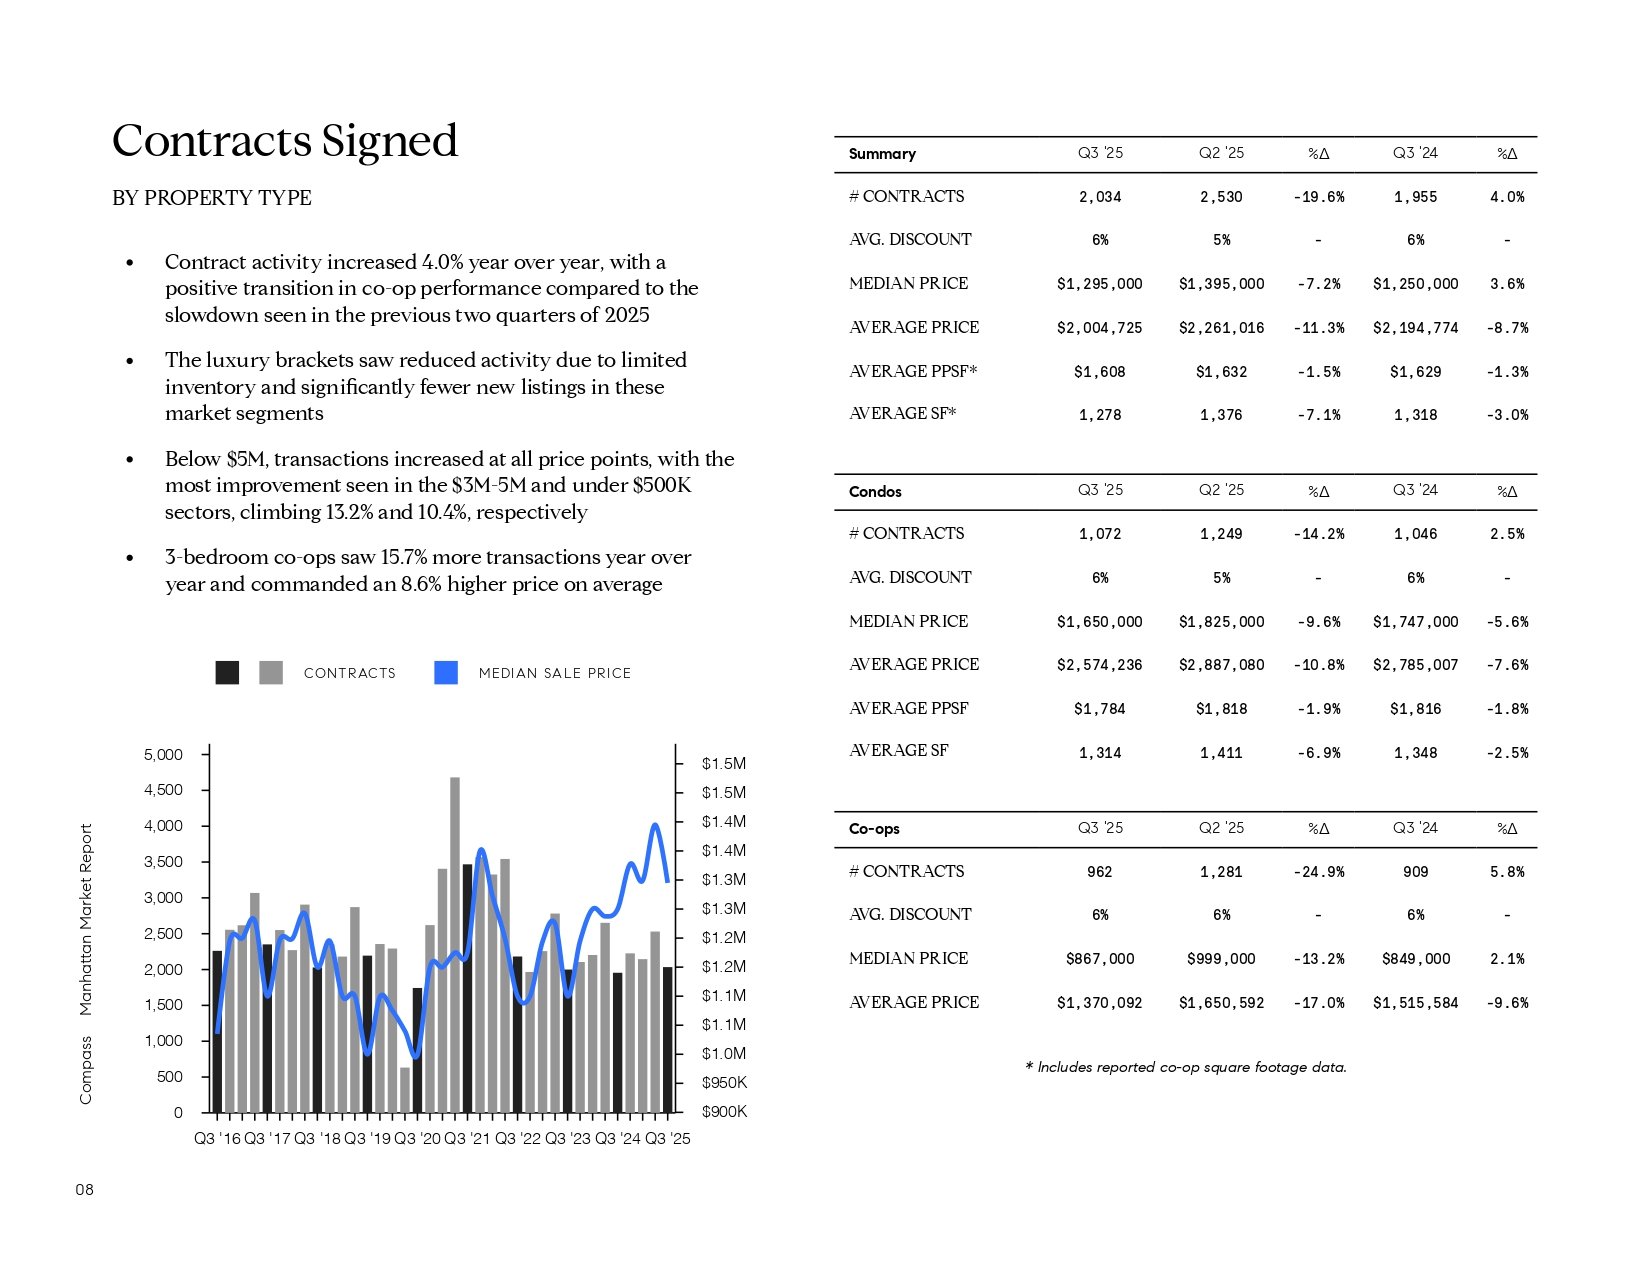
Manhattan Q3 2025 contracts-signed report with property-type analysis, a historical chart, and pricing tables.

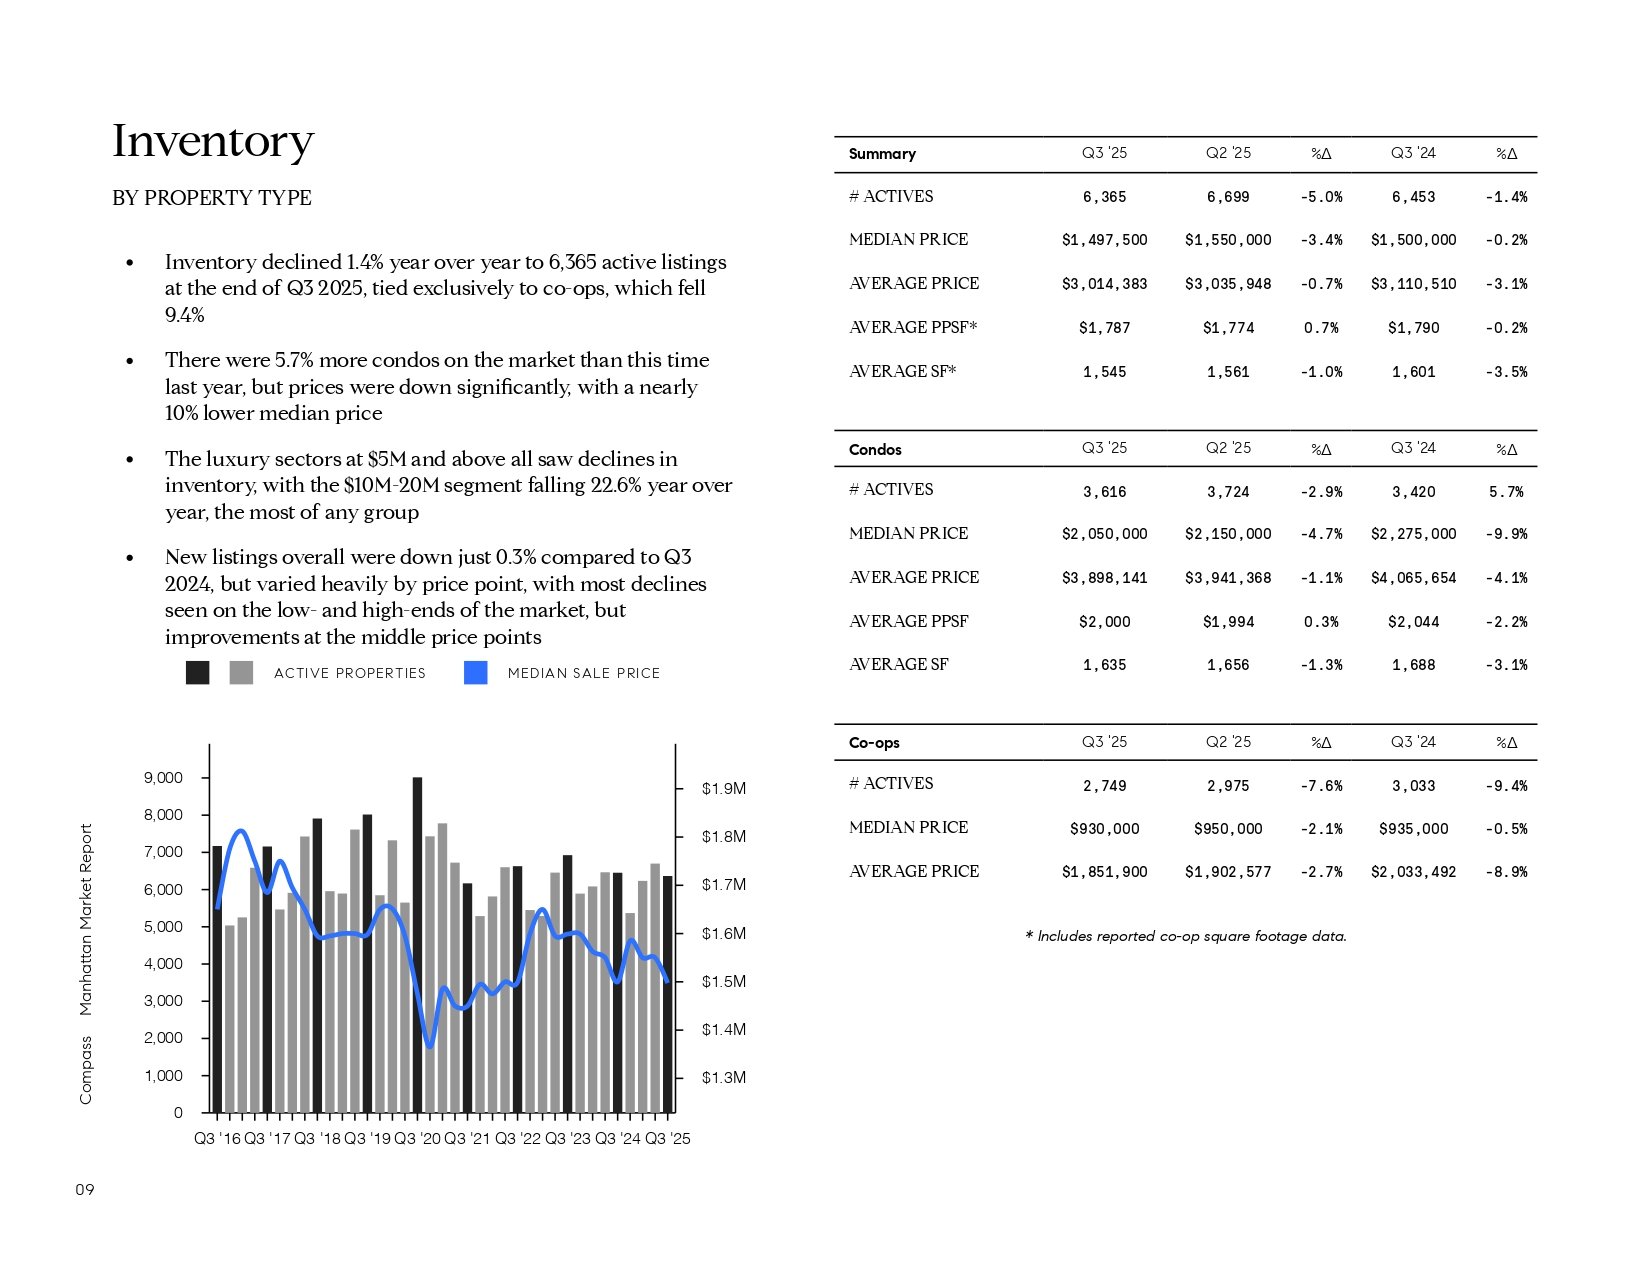
Manhattan Q3 2025 inventory report with market highlights, property-type tables, and a historical inventory and price chart.

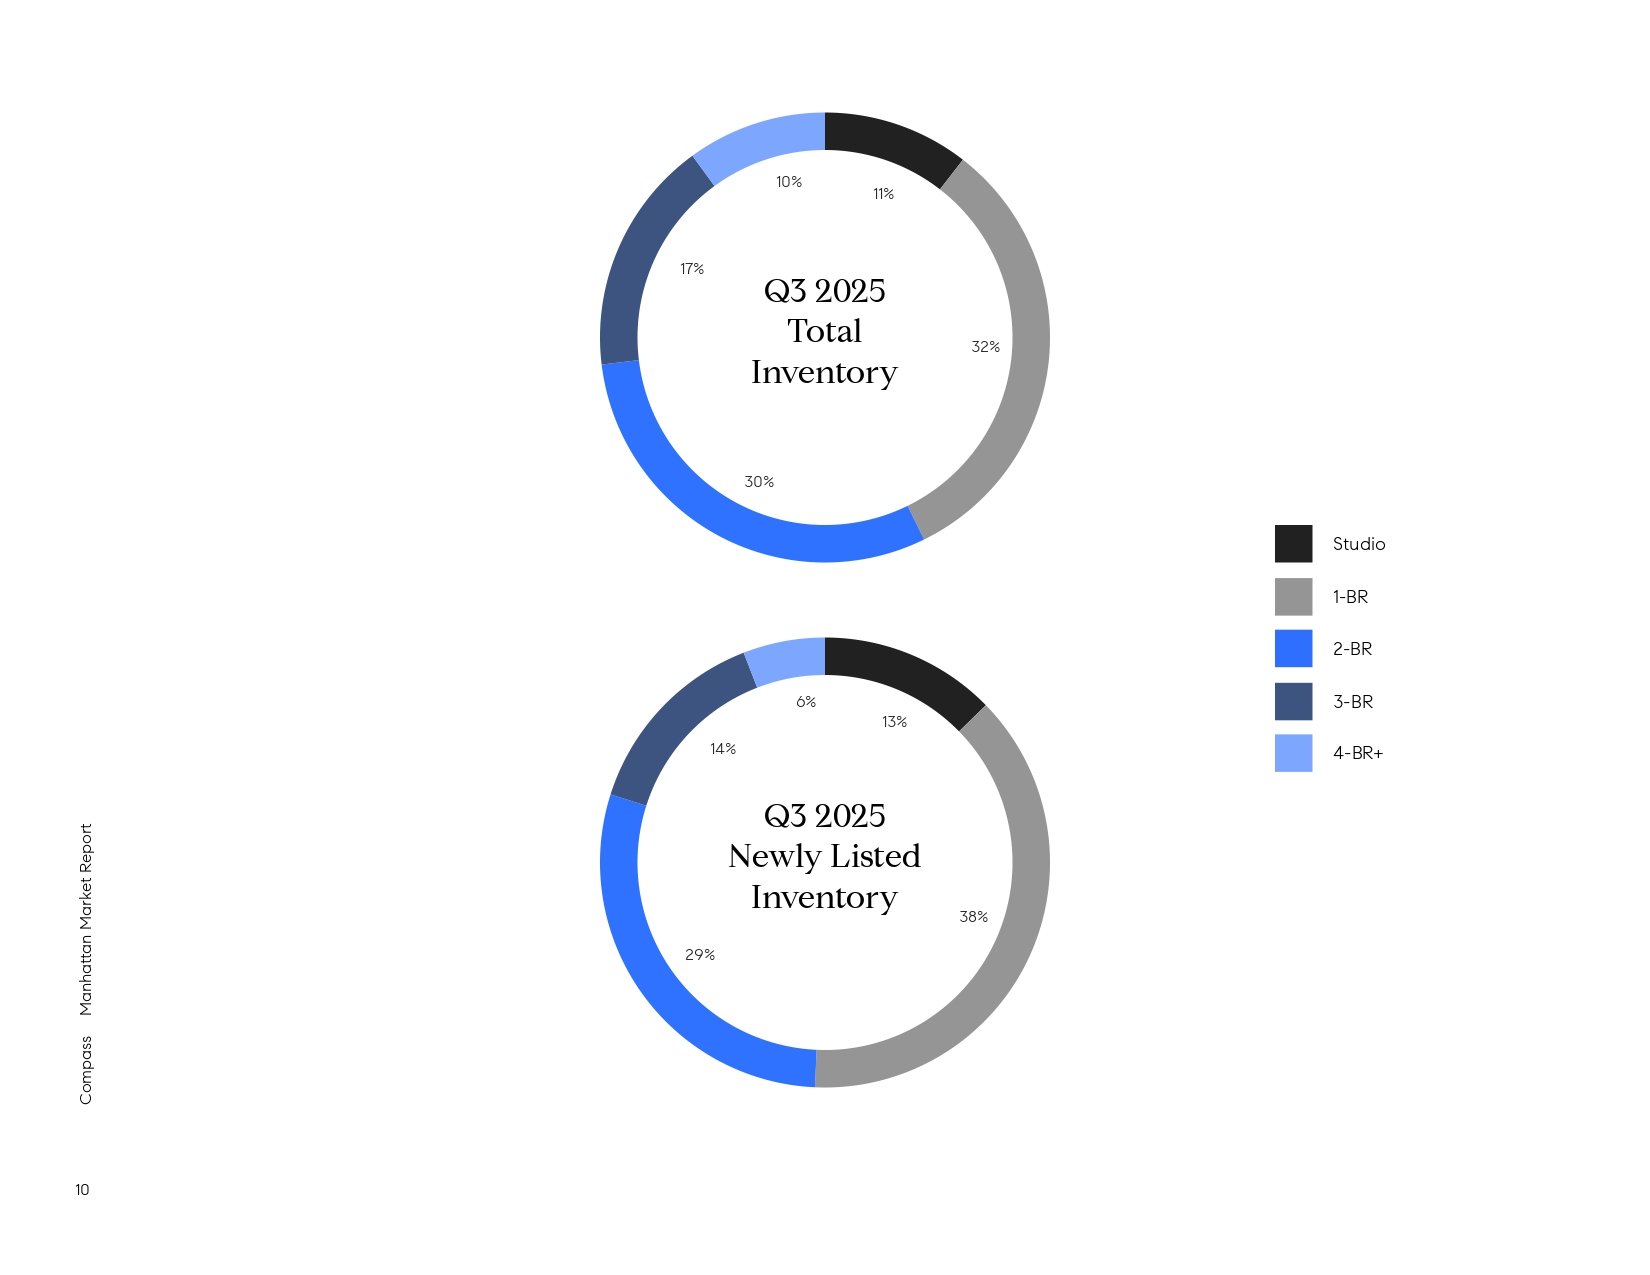
Q3 2025 Manhattan inventory and new listings by bedroom count, shown in two donut charts.

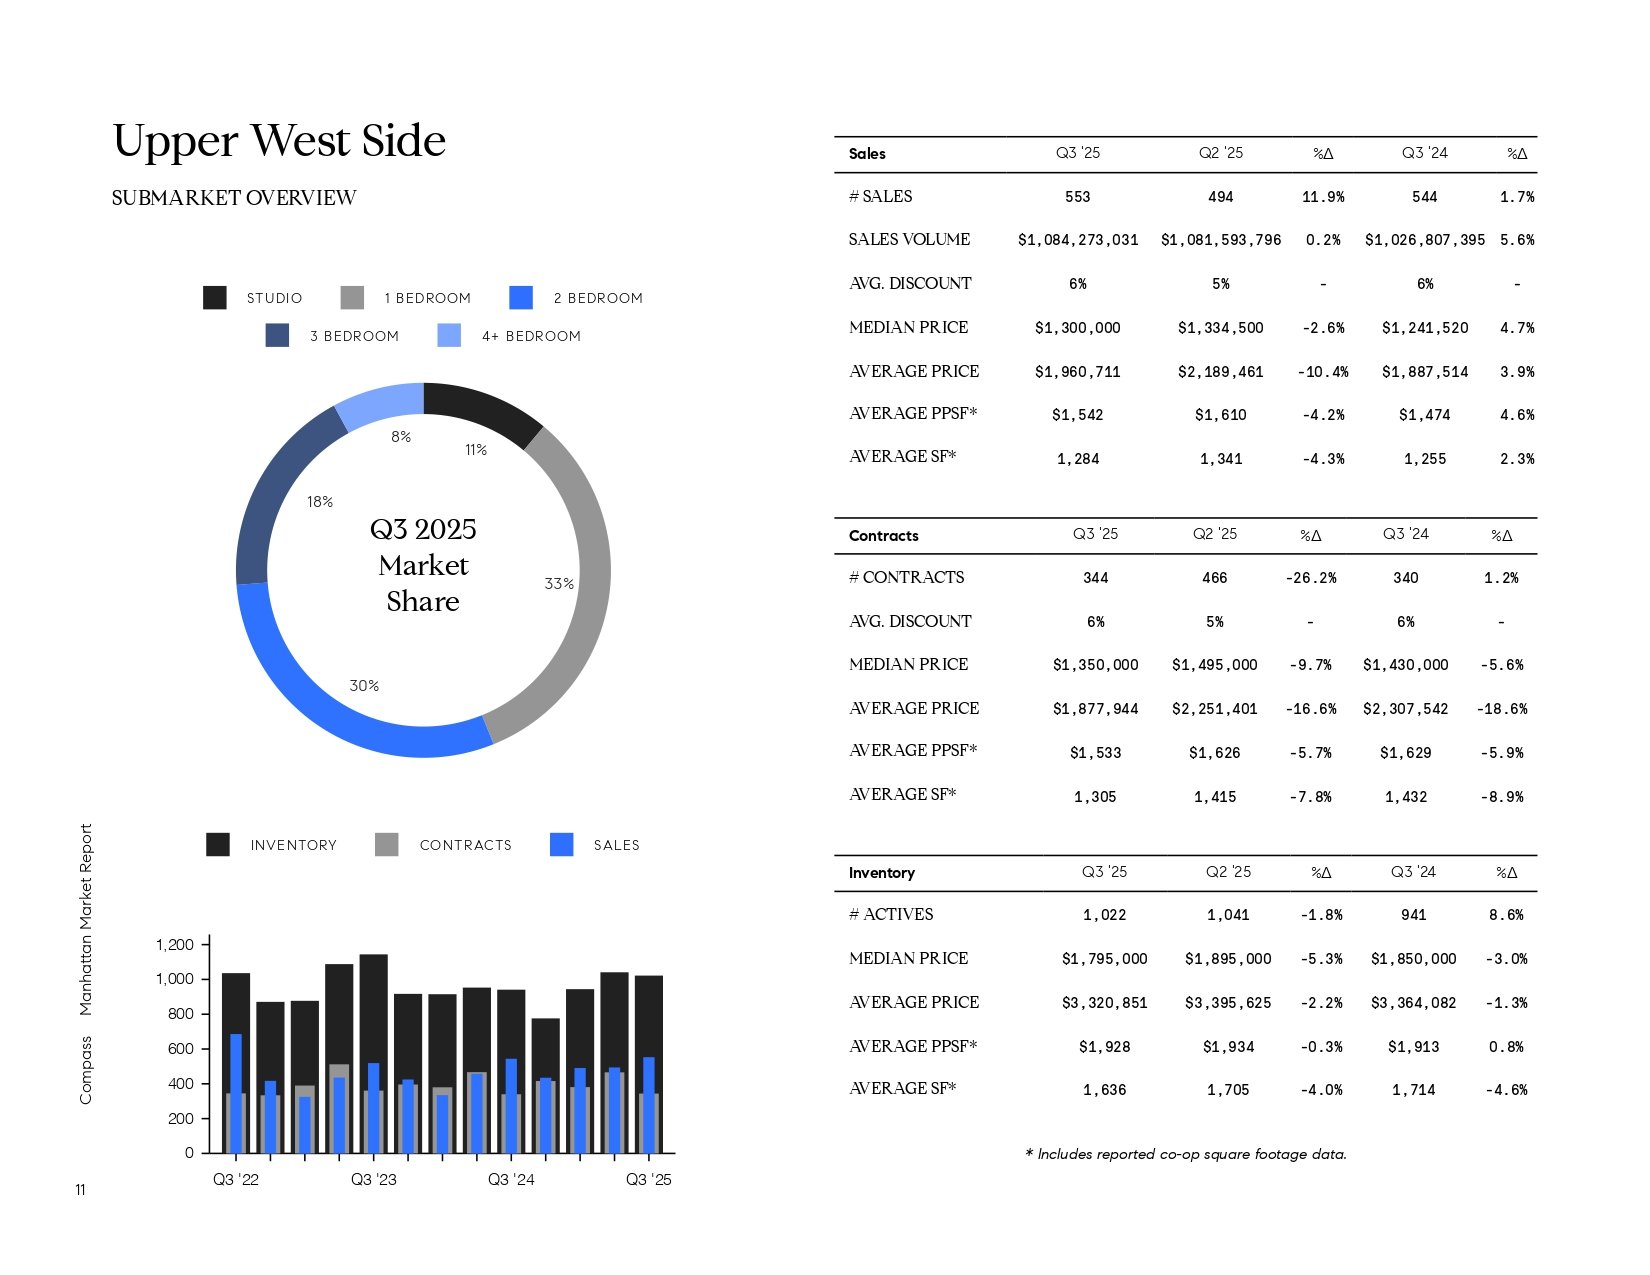
Upper West Side Q3 2025 market report with bedroom market-share chart, sales trends, and market statistics.

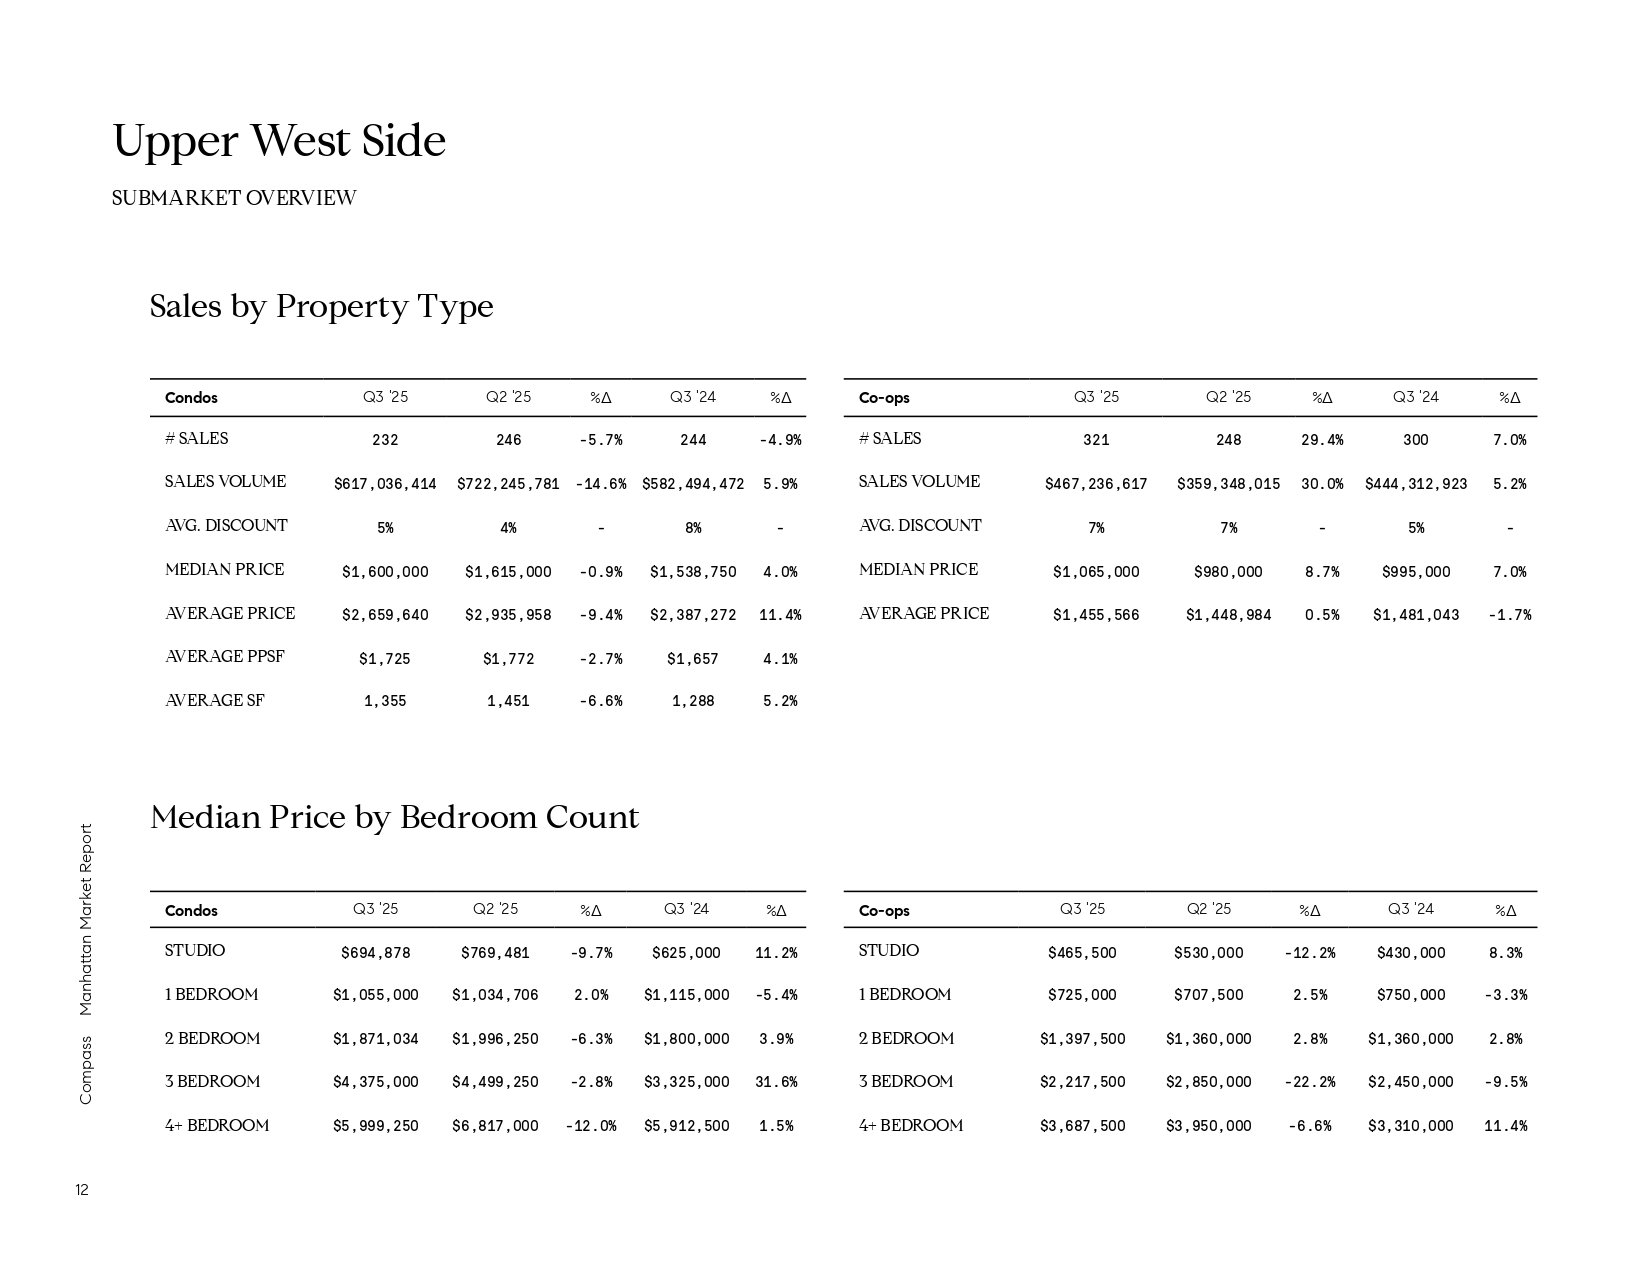
Upper West Side Q3 2025 market tables comparing condo and co-op sales and median prices by bedroom count.

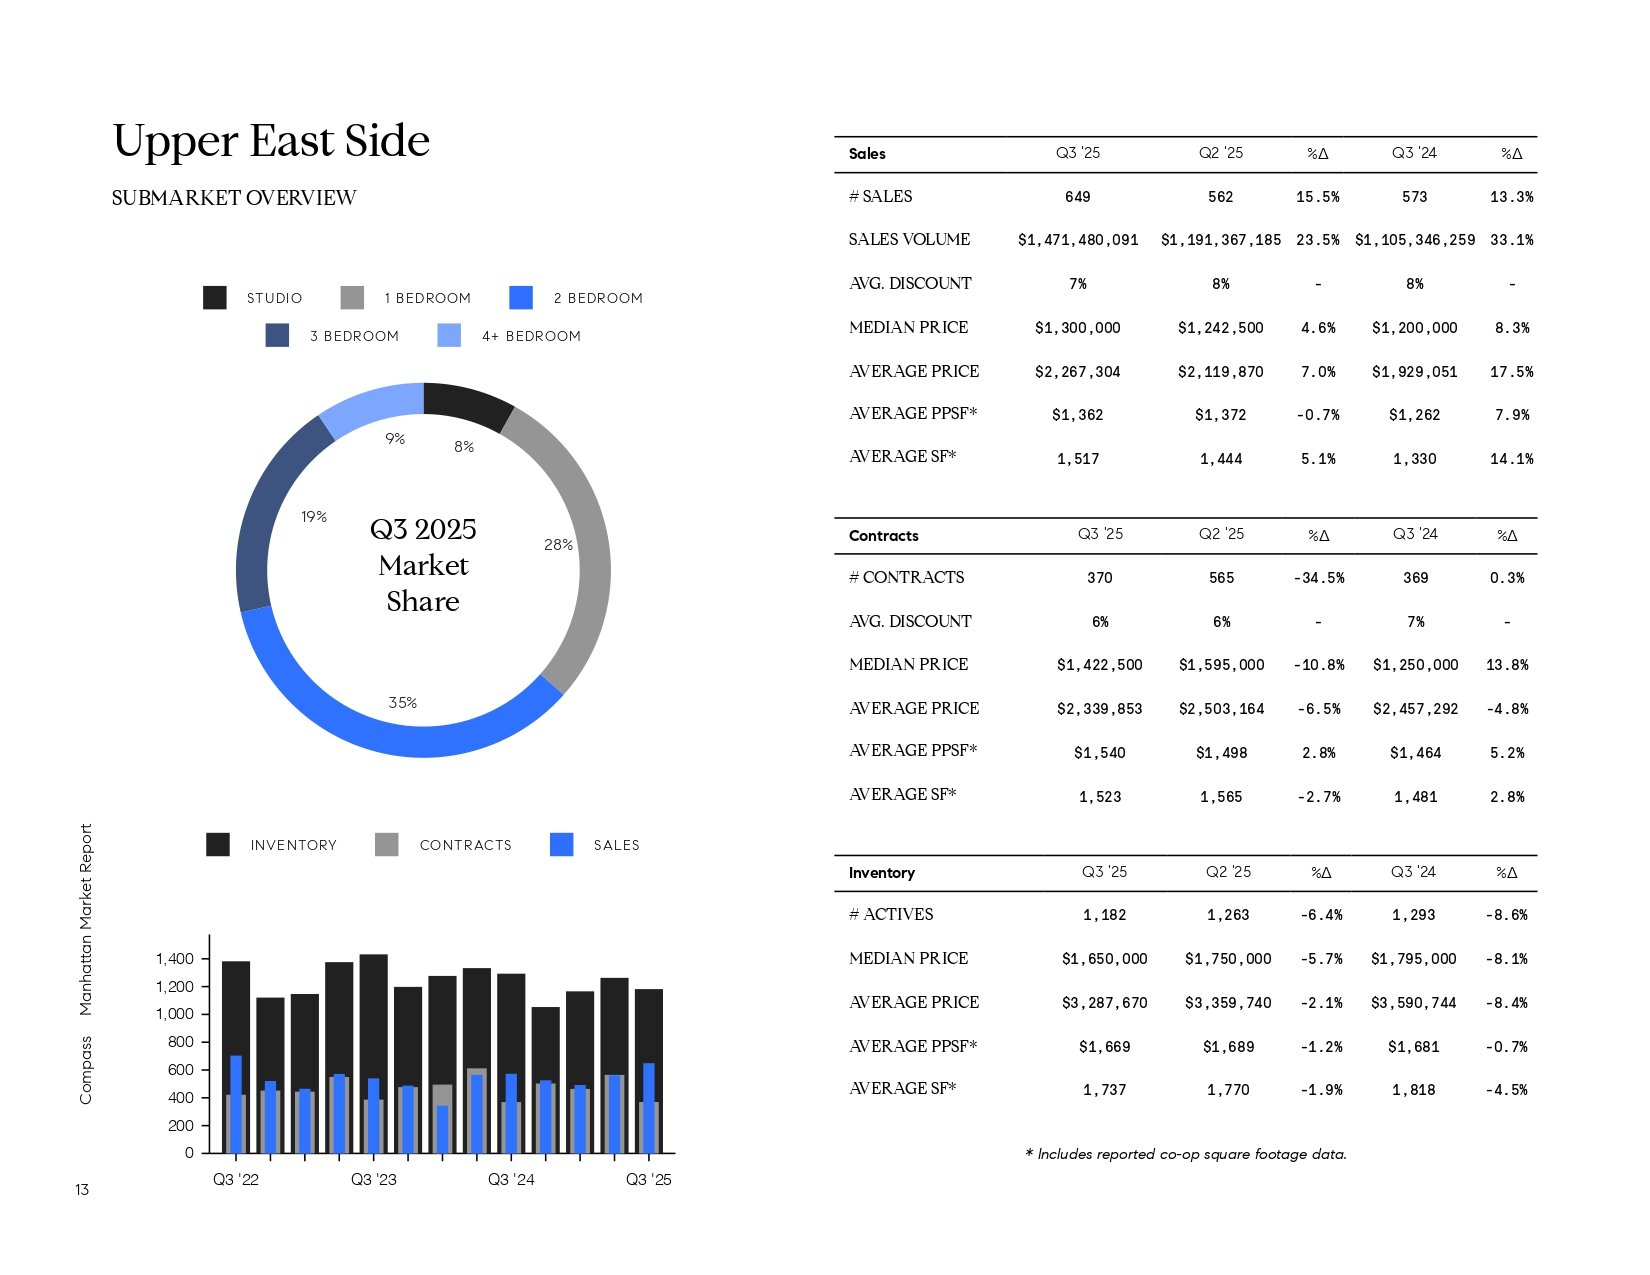
Upper East Side Q3 2025 market infographic with bedroom market-share chart and sales, contracts, and inventory comparisons.

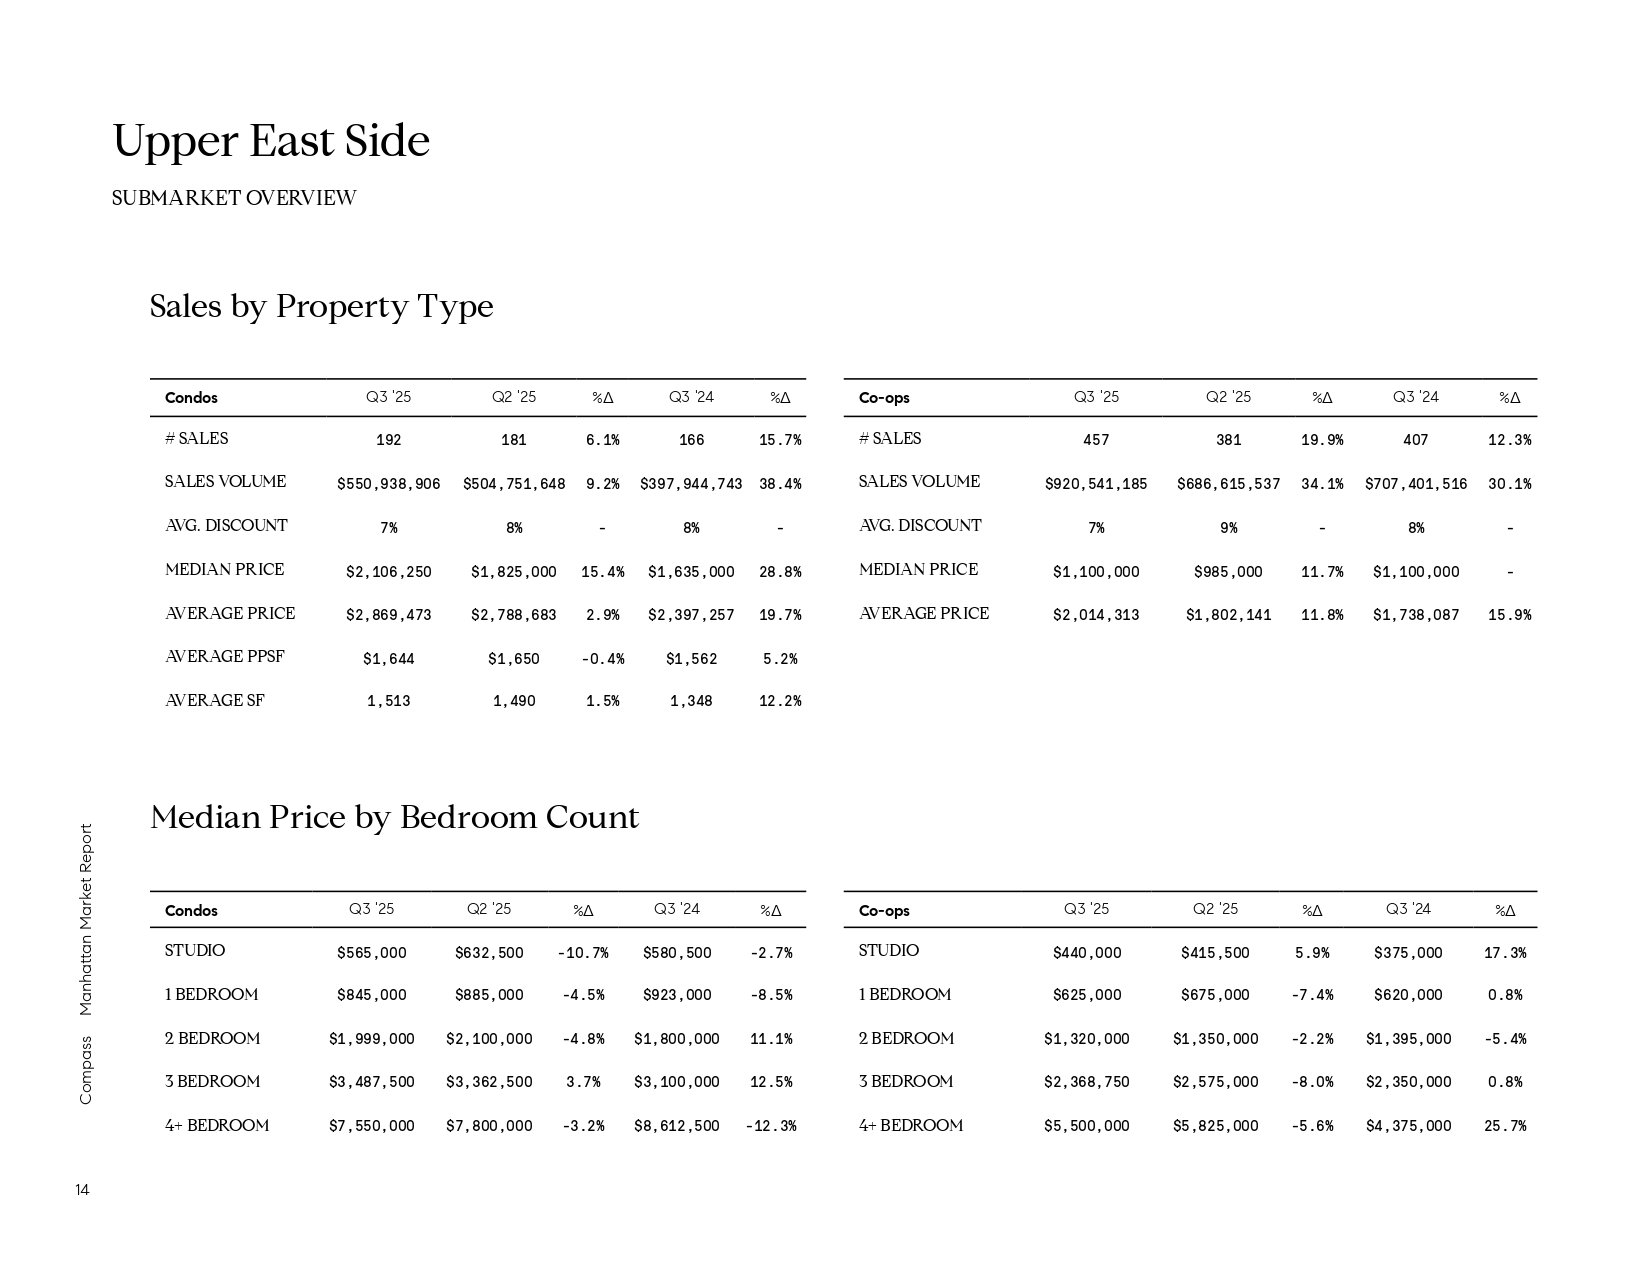
Upper East Side market tables compare Q3 2025 condo and co-op sales and median prices by bedroom count.

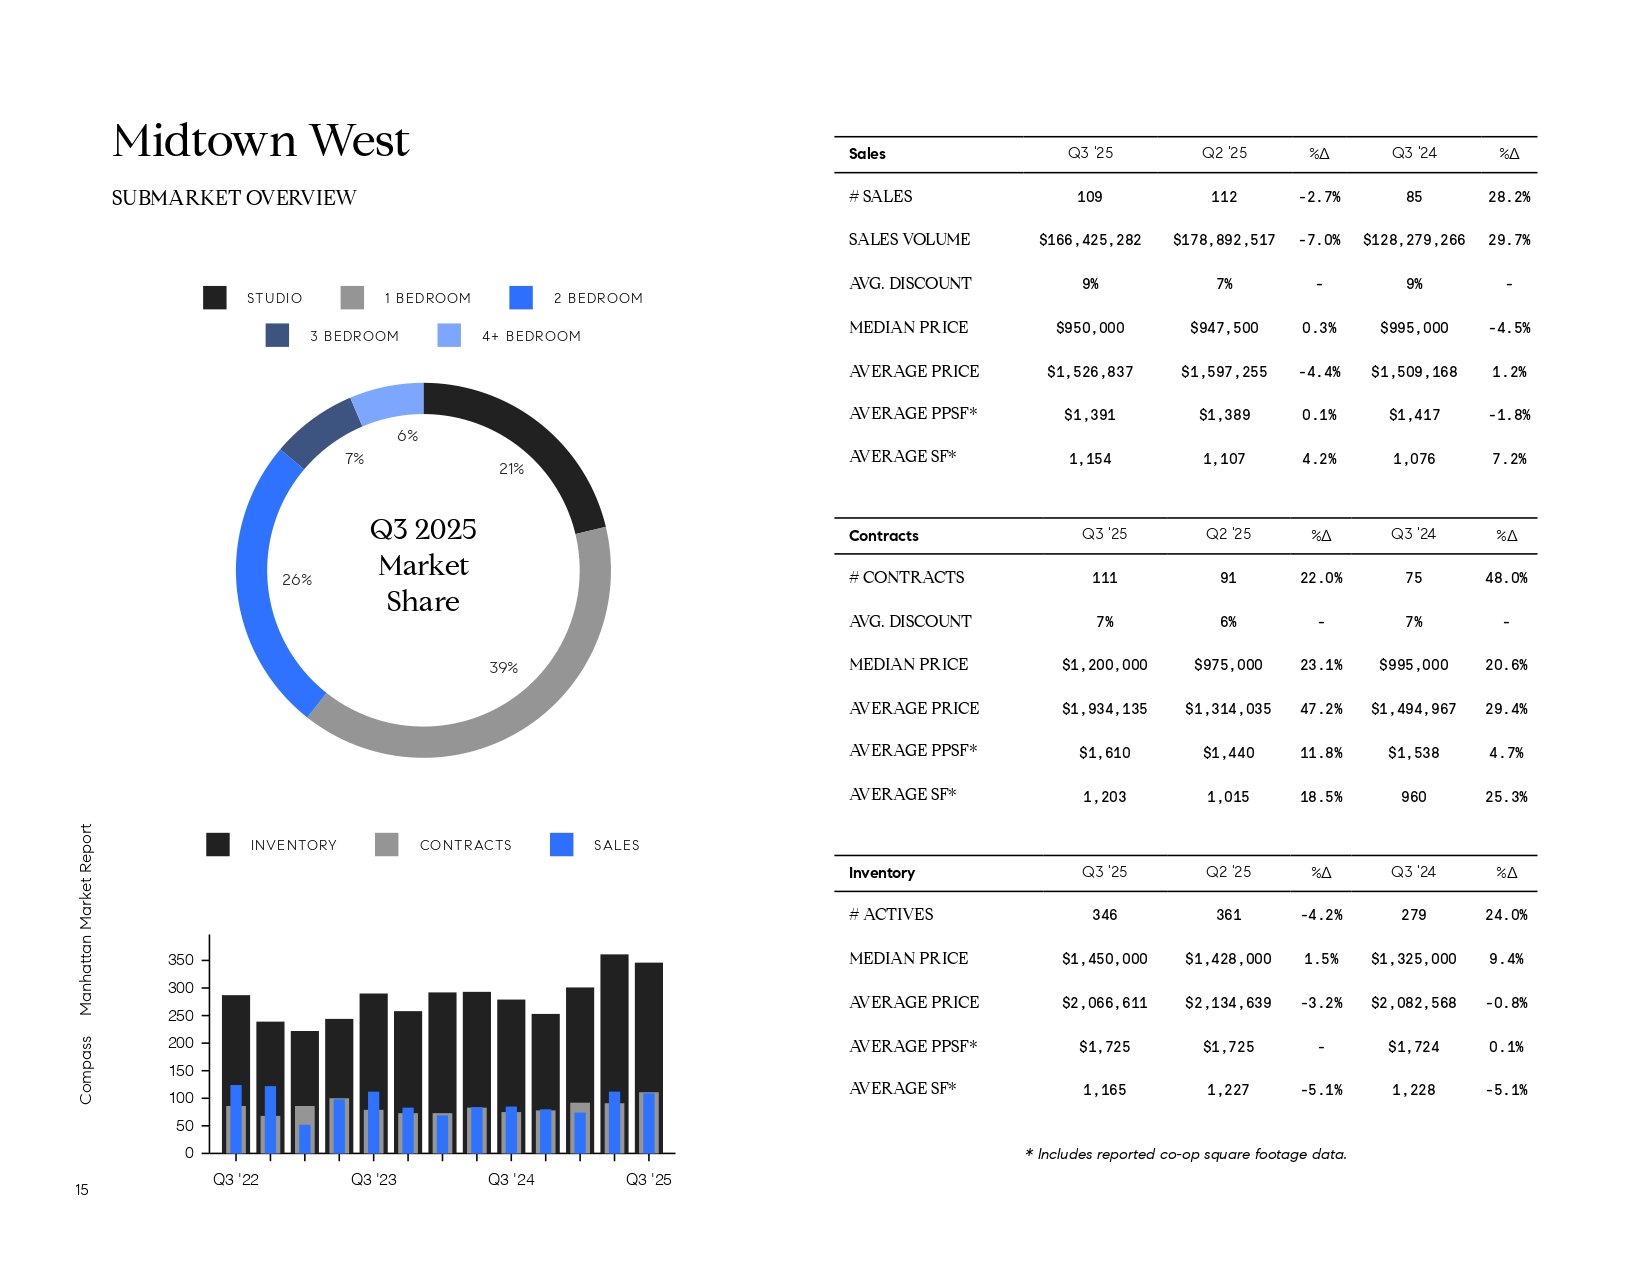
Midtown West Q3 2025 market report with bedroom market-share chart, quarterly activity bars, and sales, contracts, and inventory tables.

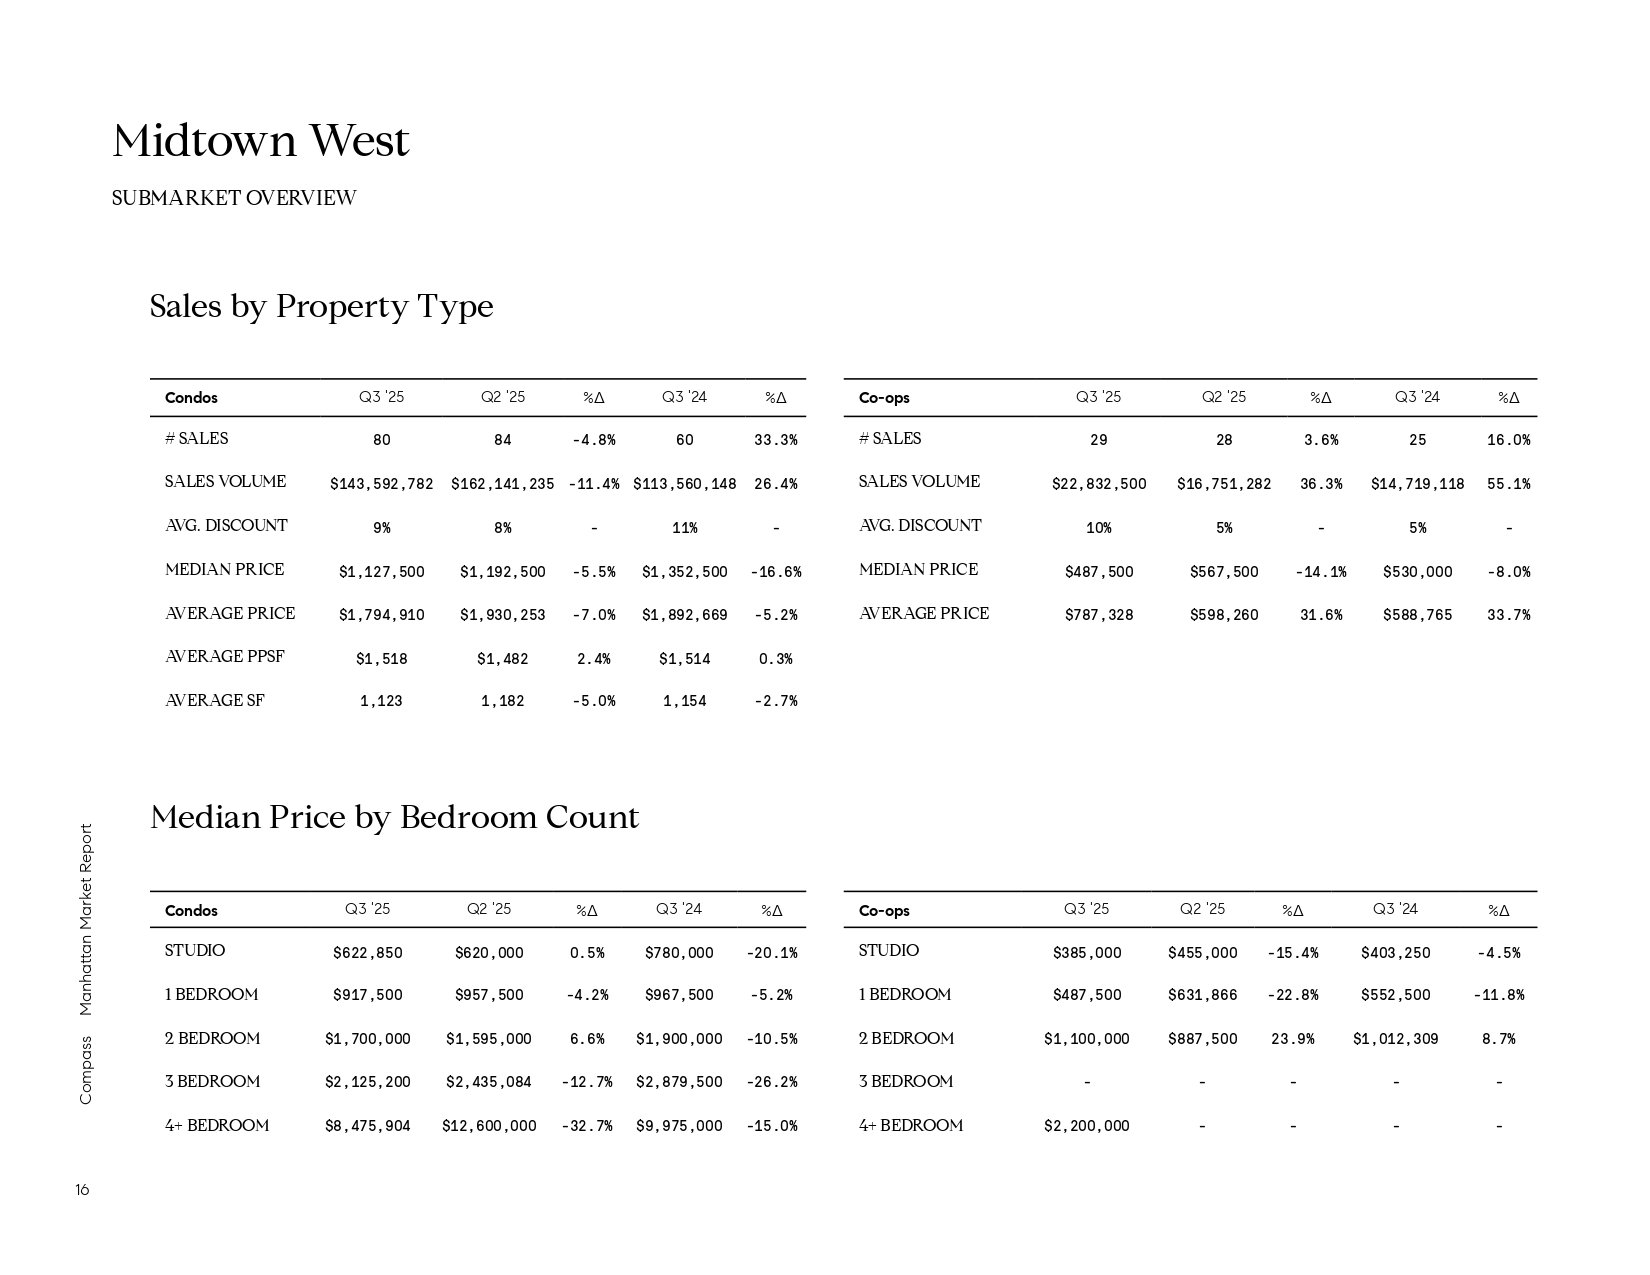
Midtown West Q3 2025 market tables comparing condo and co-op sales and median prices by bedroom count.

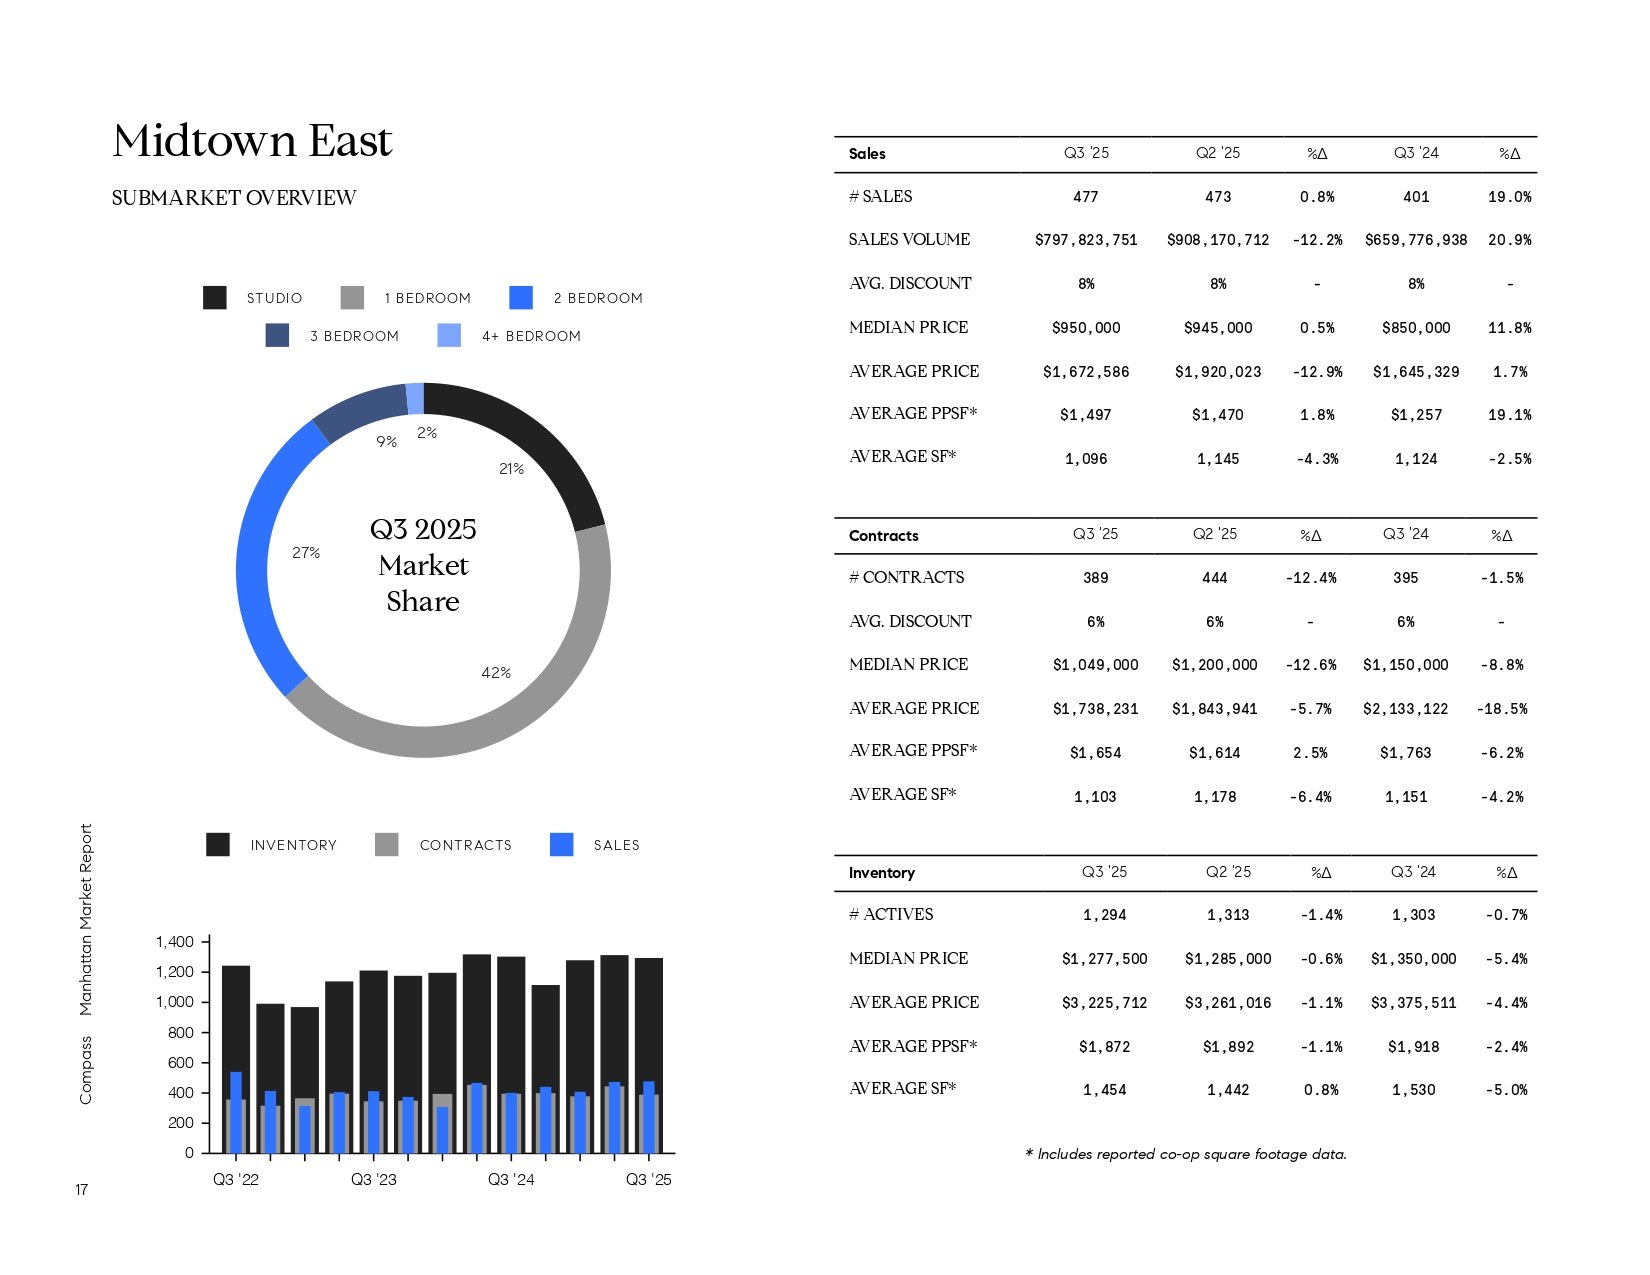
Midtown East Q3 2025 market infographic with bedroom market shares, historical activity chart, and sales, contracts, and inventory tables.

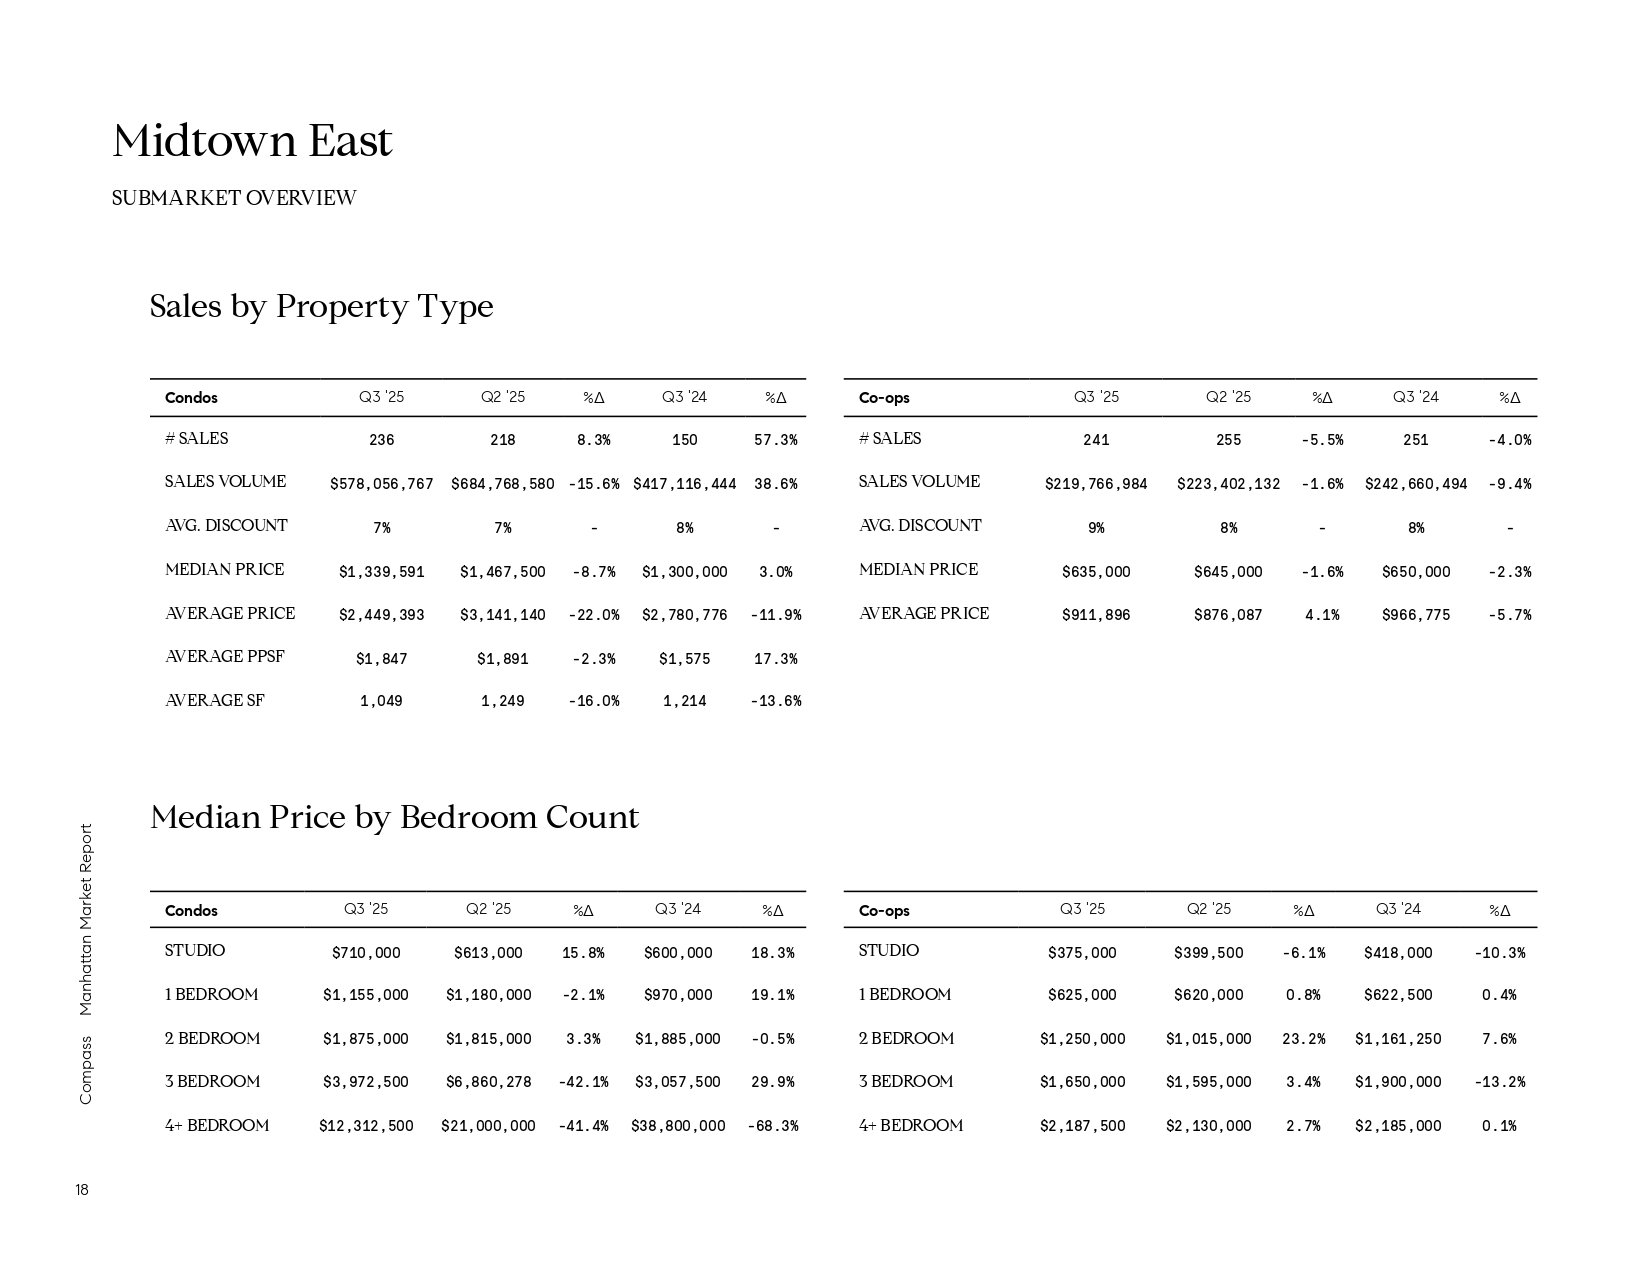
Midtown East Q3 2025 market report comparing condo and co-op sales and median prices by bedroom count.

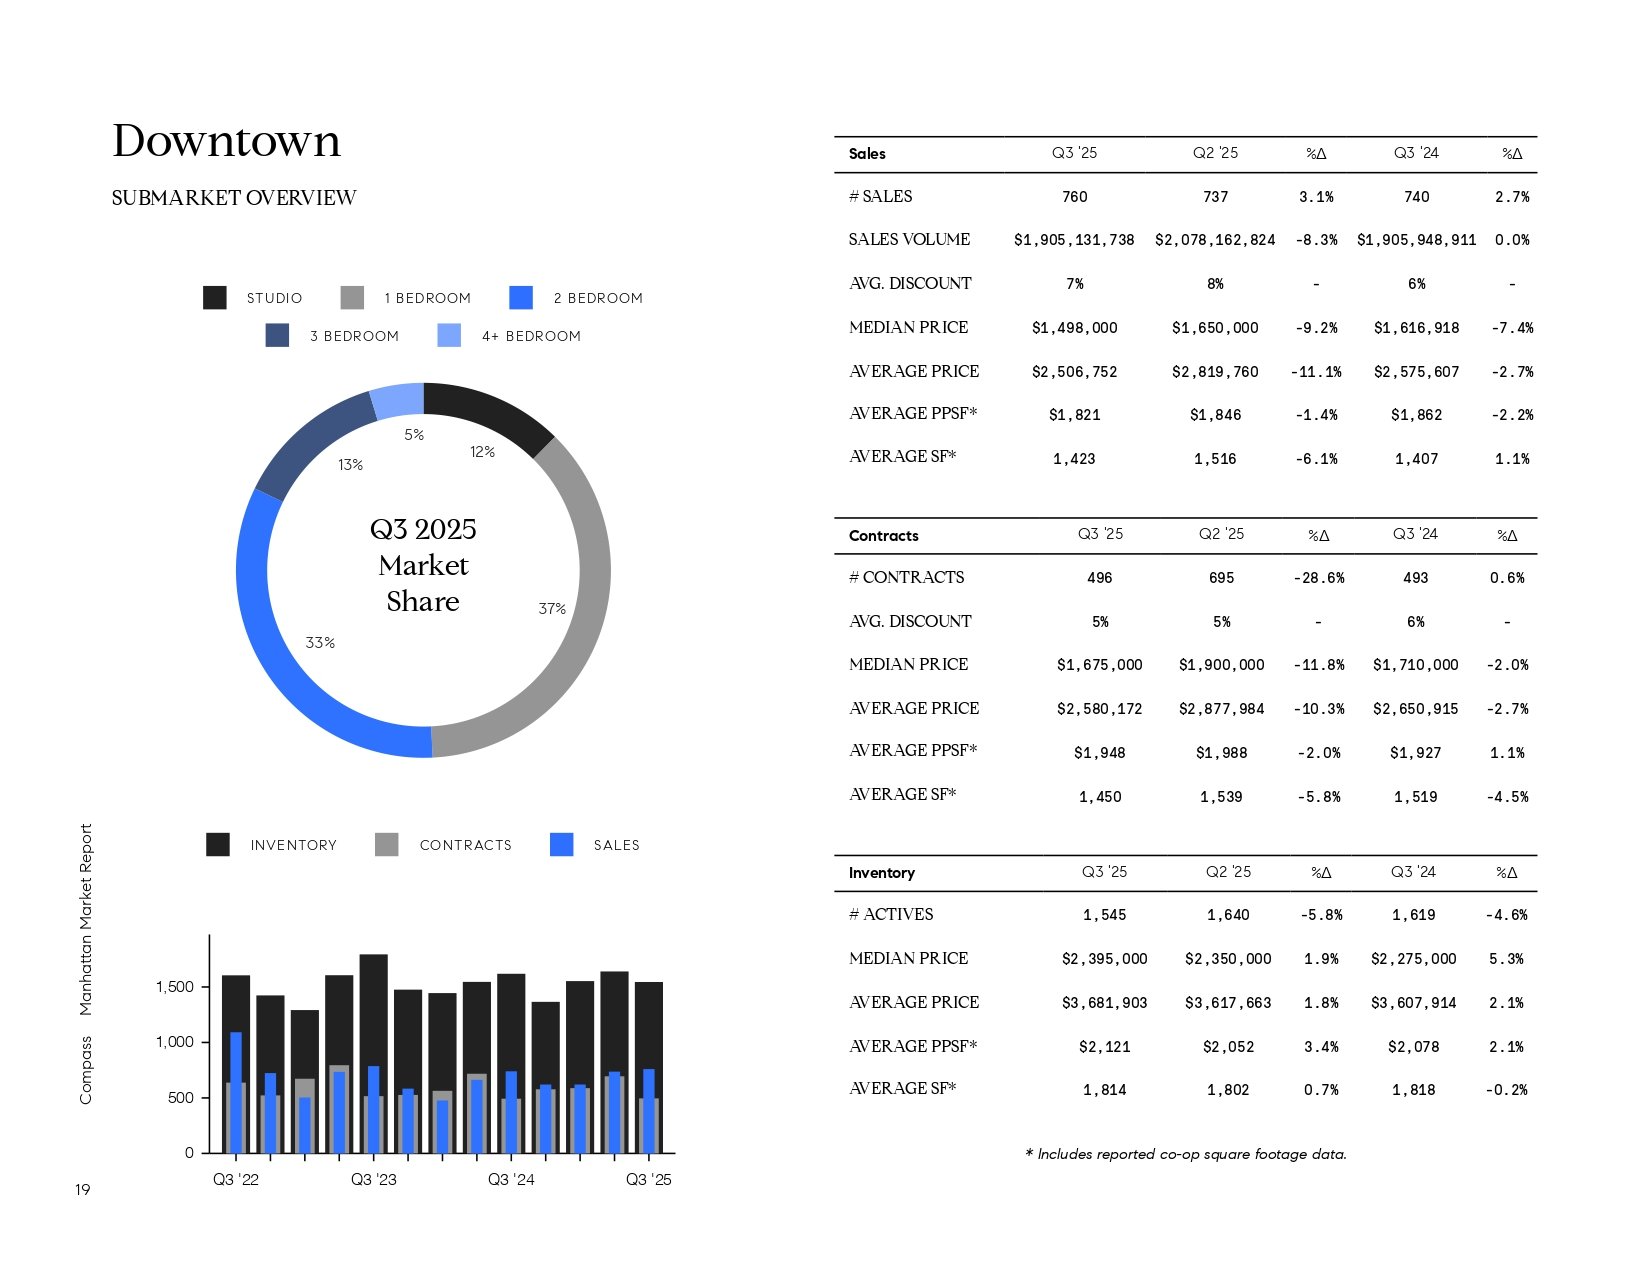
Downtown Manhattan Q3 2025 market report with bedroom-share and historical activity charts plus sales, contract, and inventory tables.

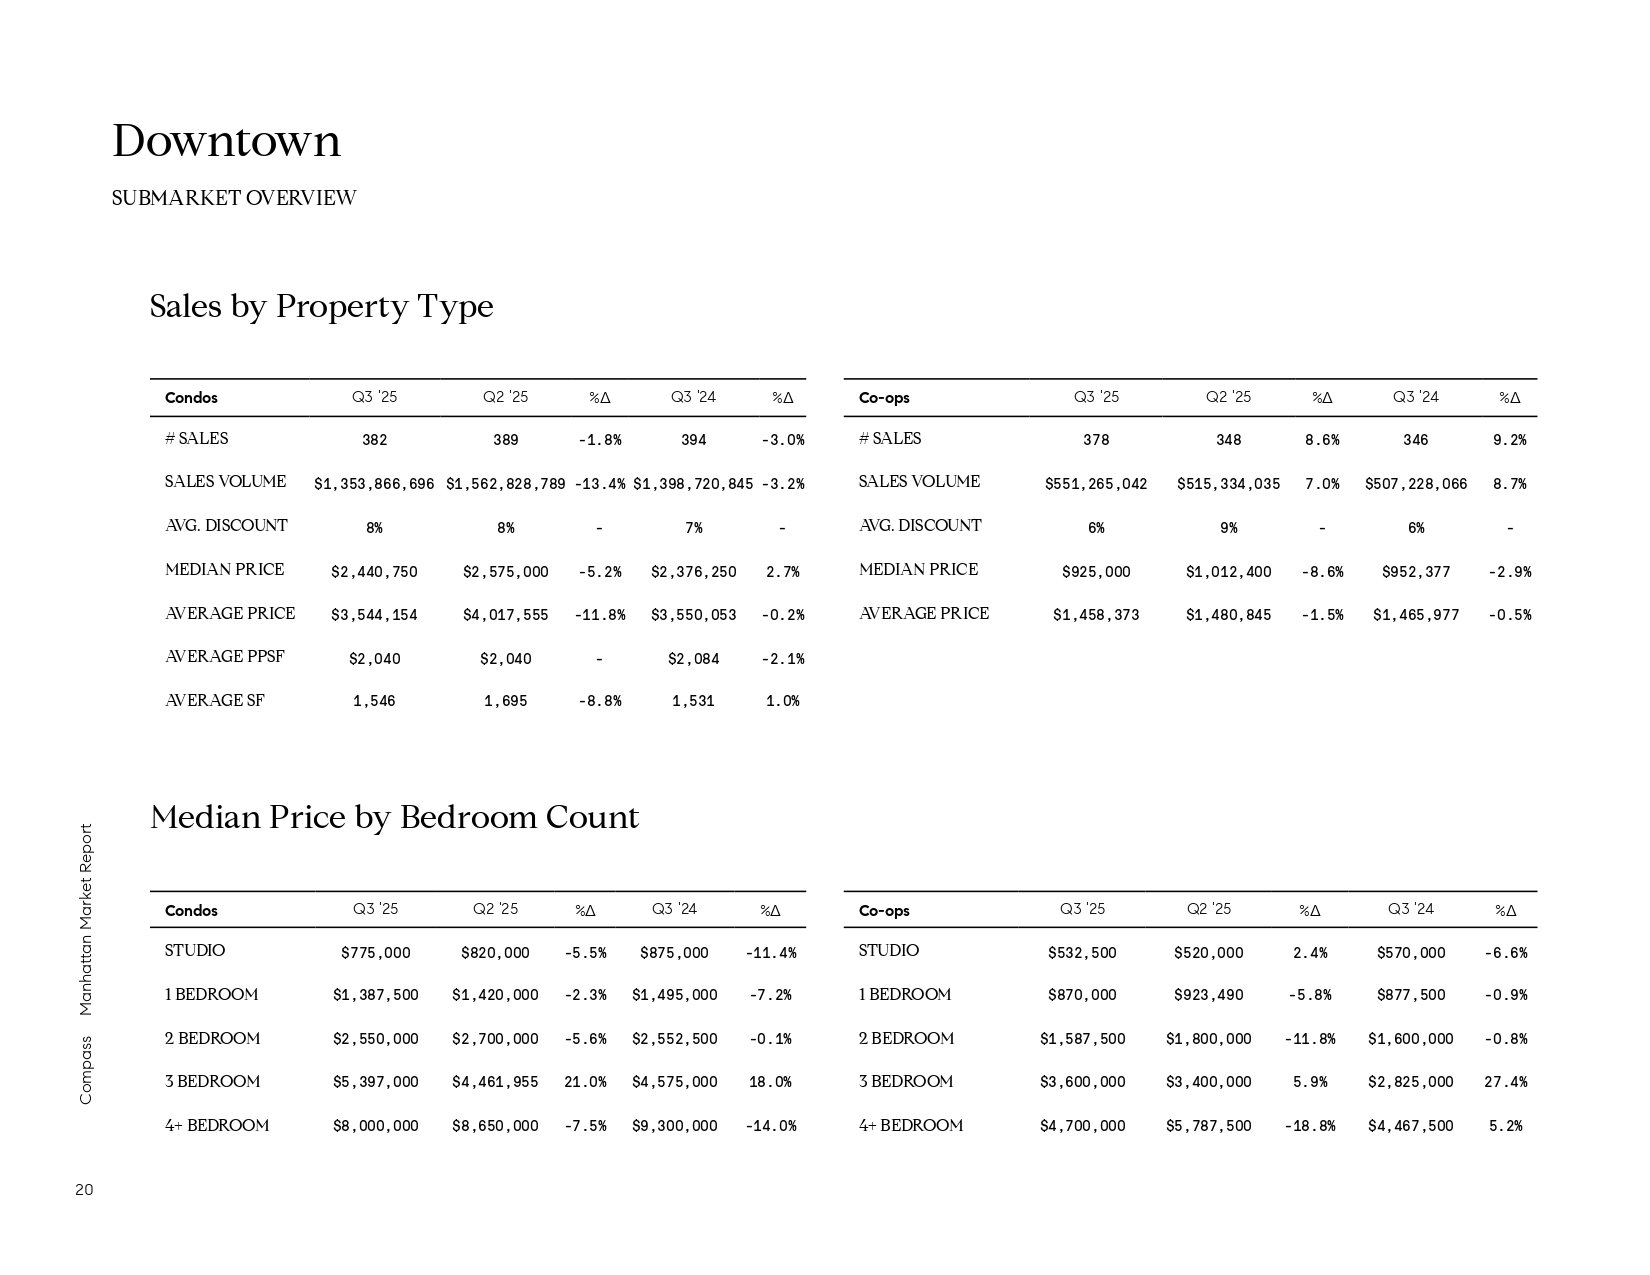
Downtown Manhattan Q3 2025 tables compare condo and co-op sales and median prices by bedroom count.

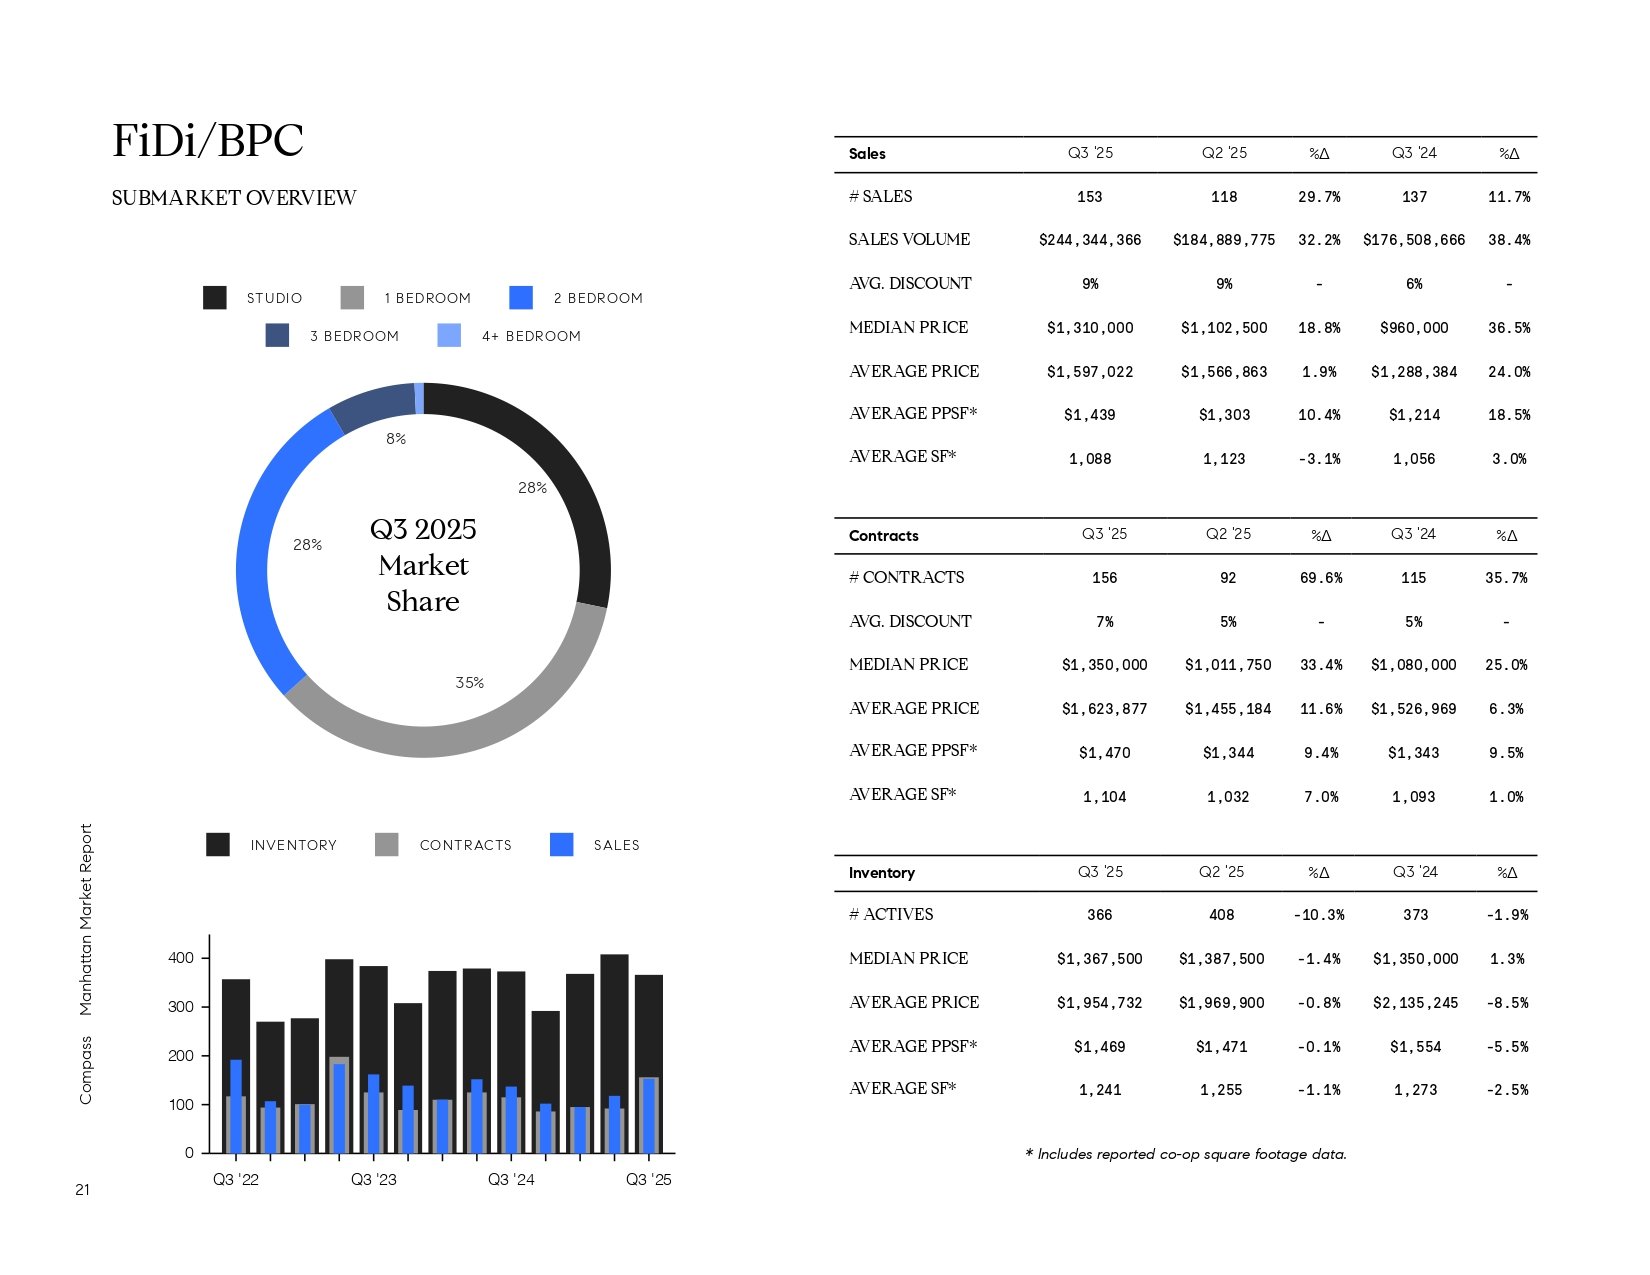
FiDi/BPC Q3 2025 market report with apartment-size market share, quarterly activity chart, and sales, contracts, and inventory tables.

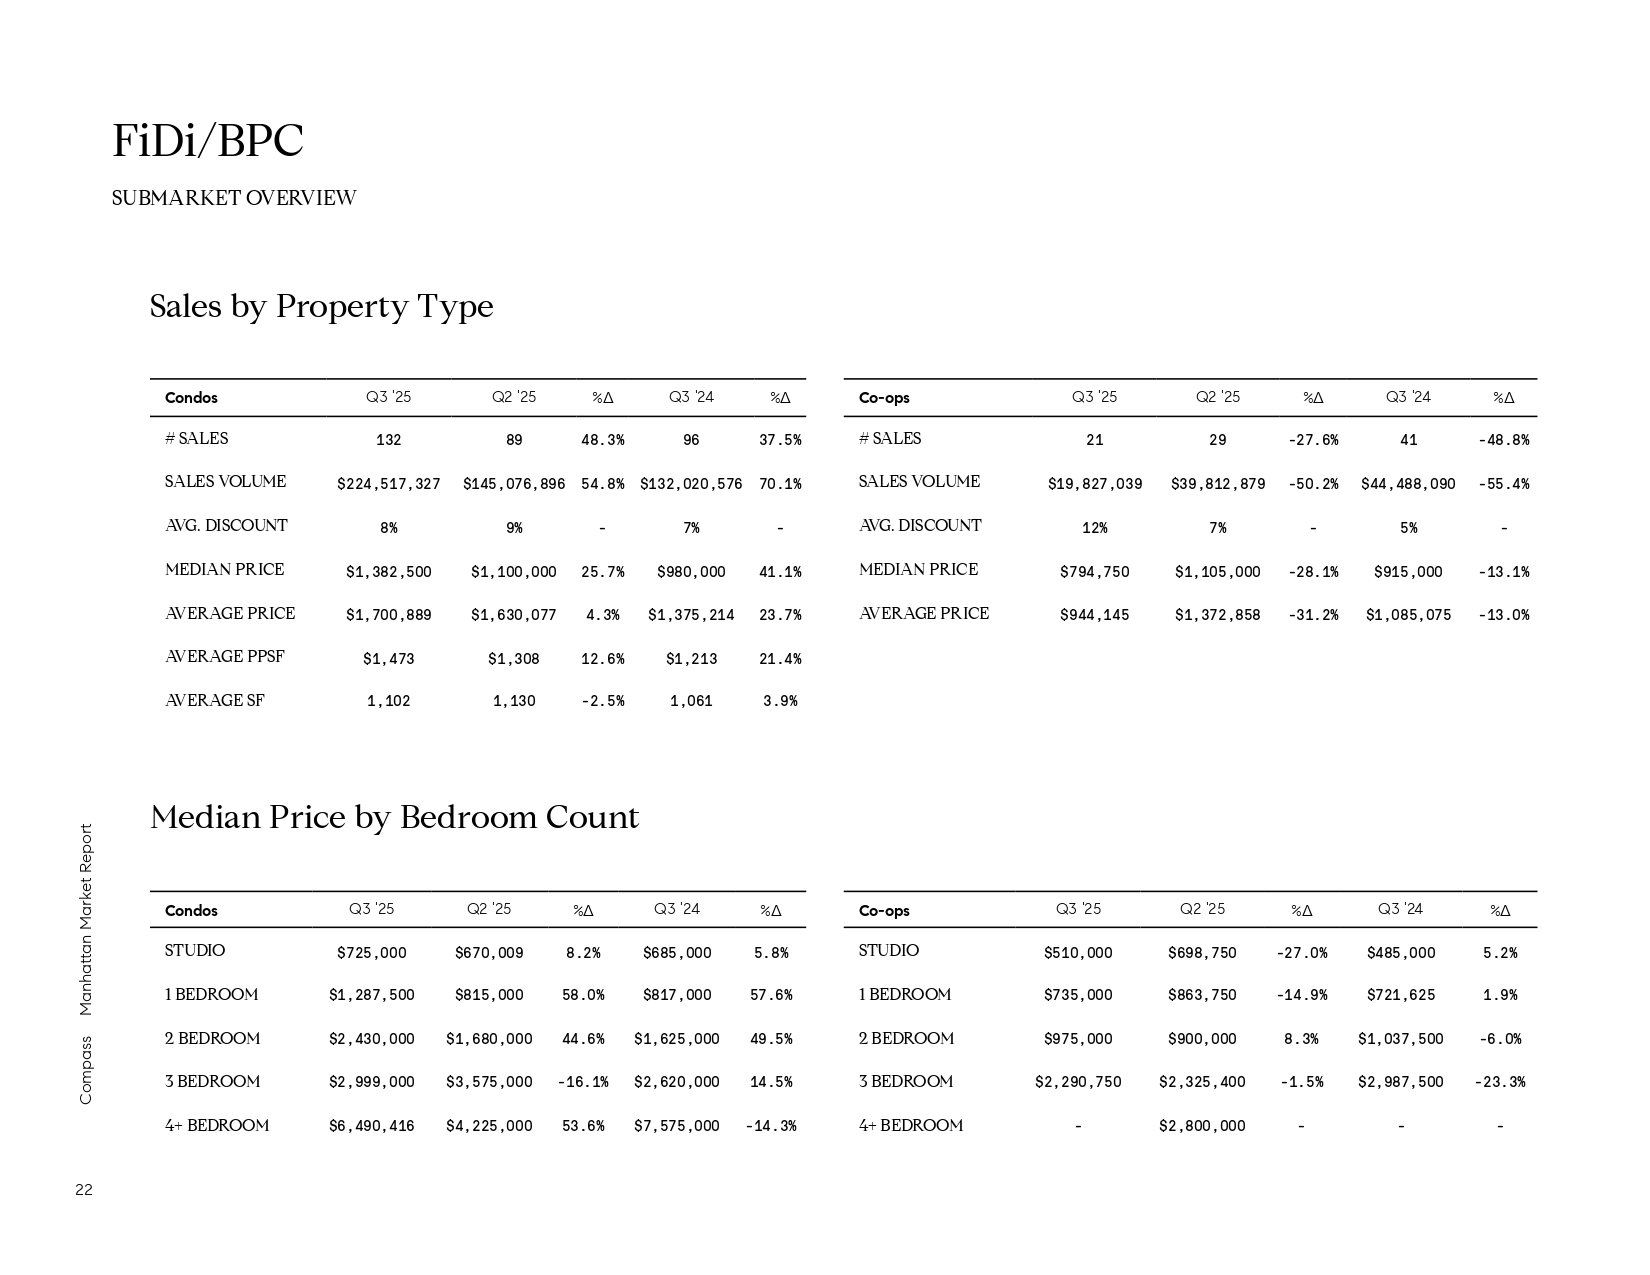
FiDi/BPC market tables compare condo and co-op sales and median prices by bedroom count.

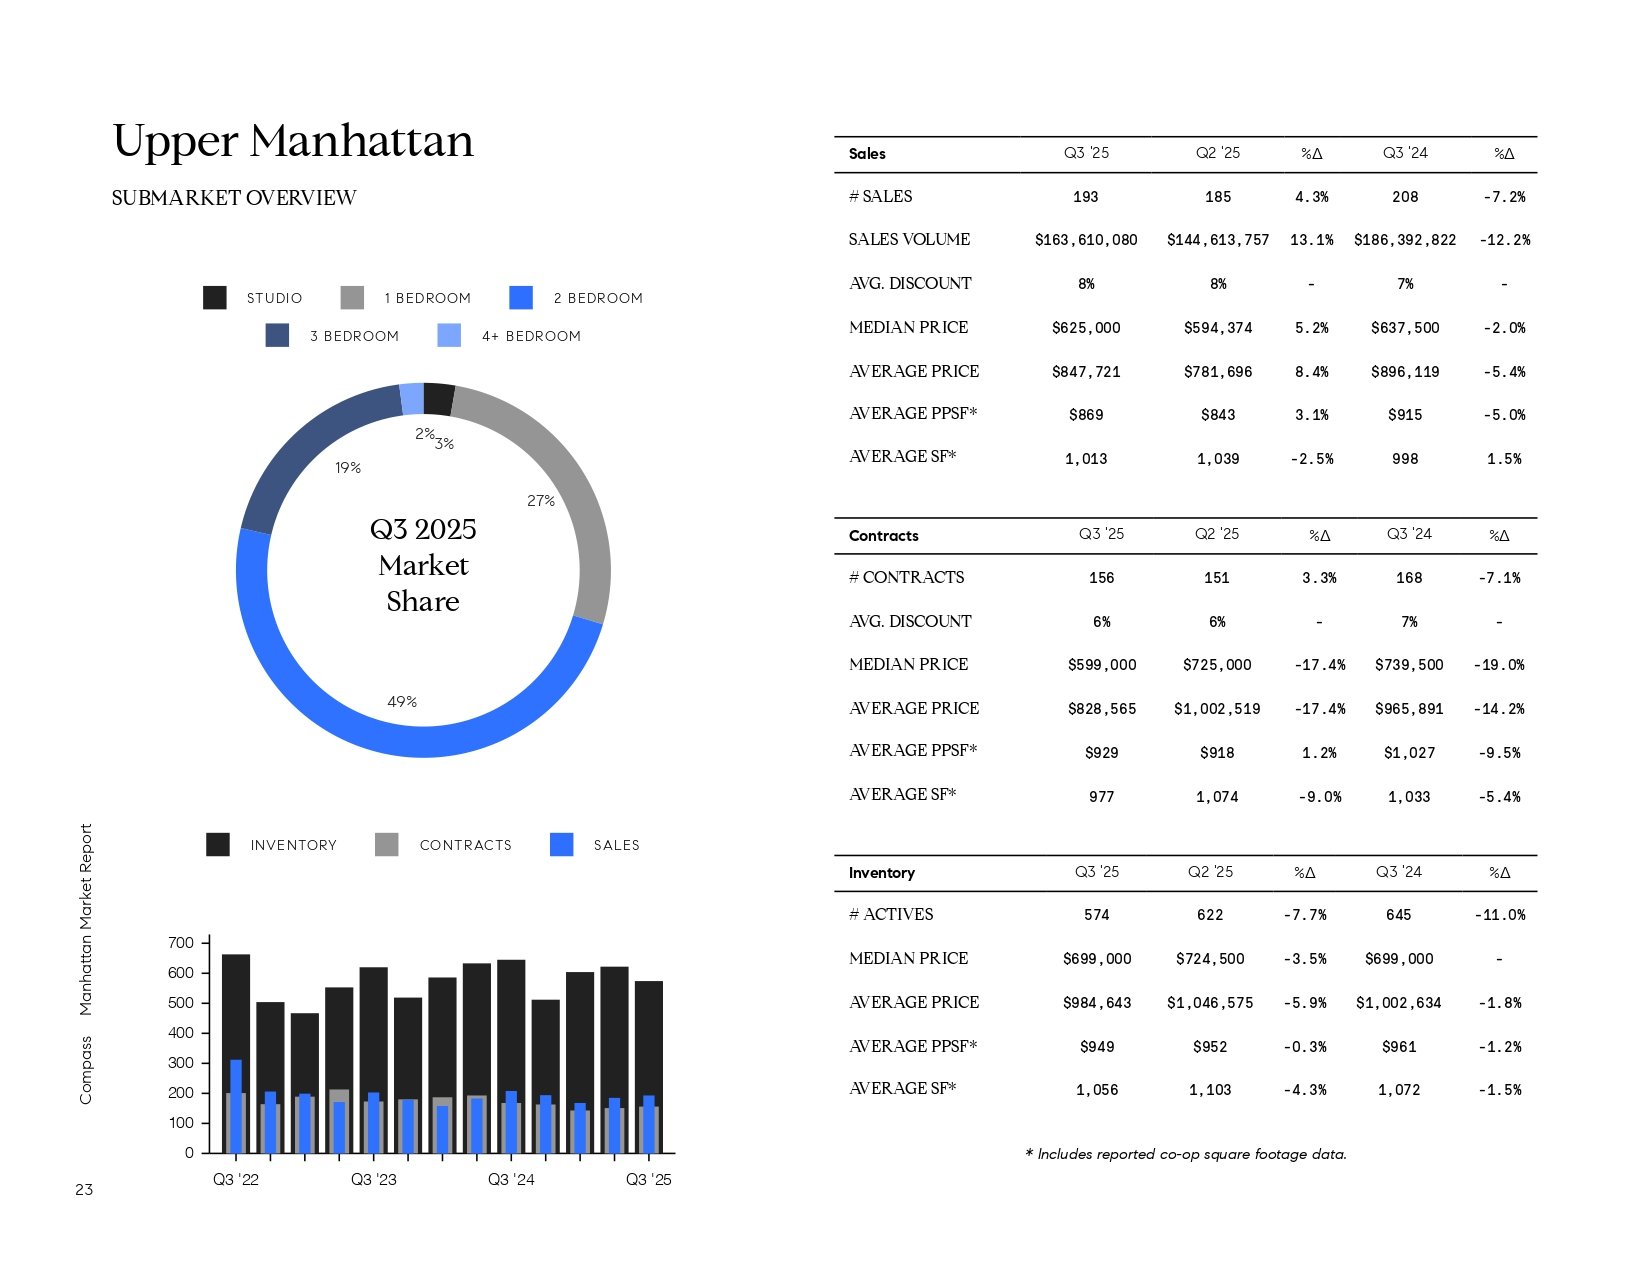
Upper Manhattan Q3 2025 market infographic with bedroom-type market share, quarterly activity chart, and sales, contracts, and inventory tables.

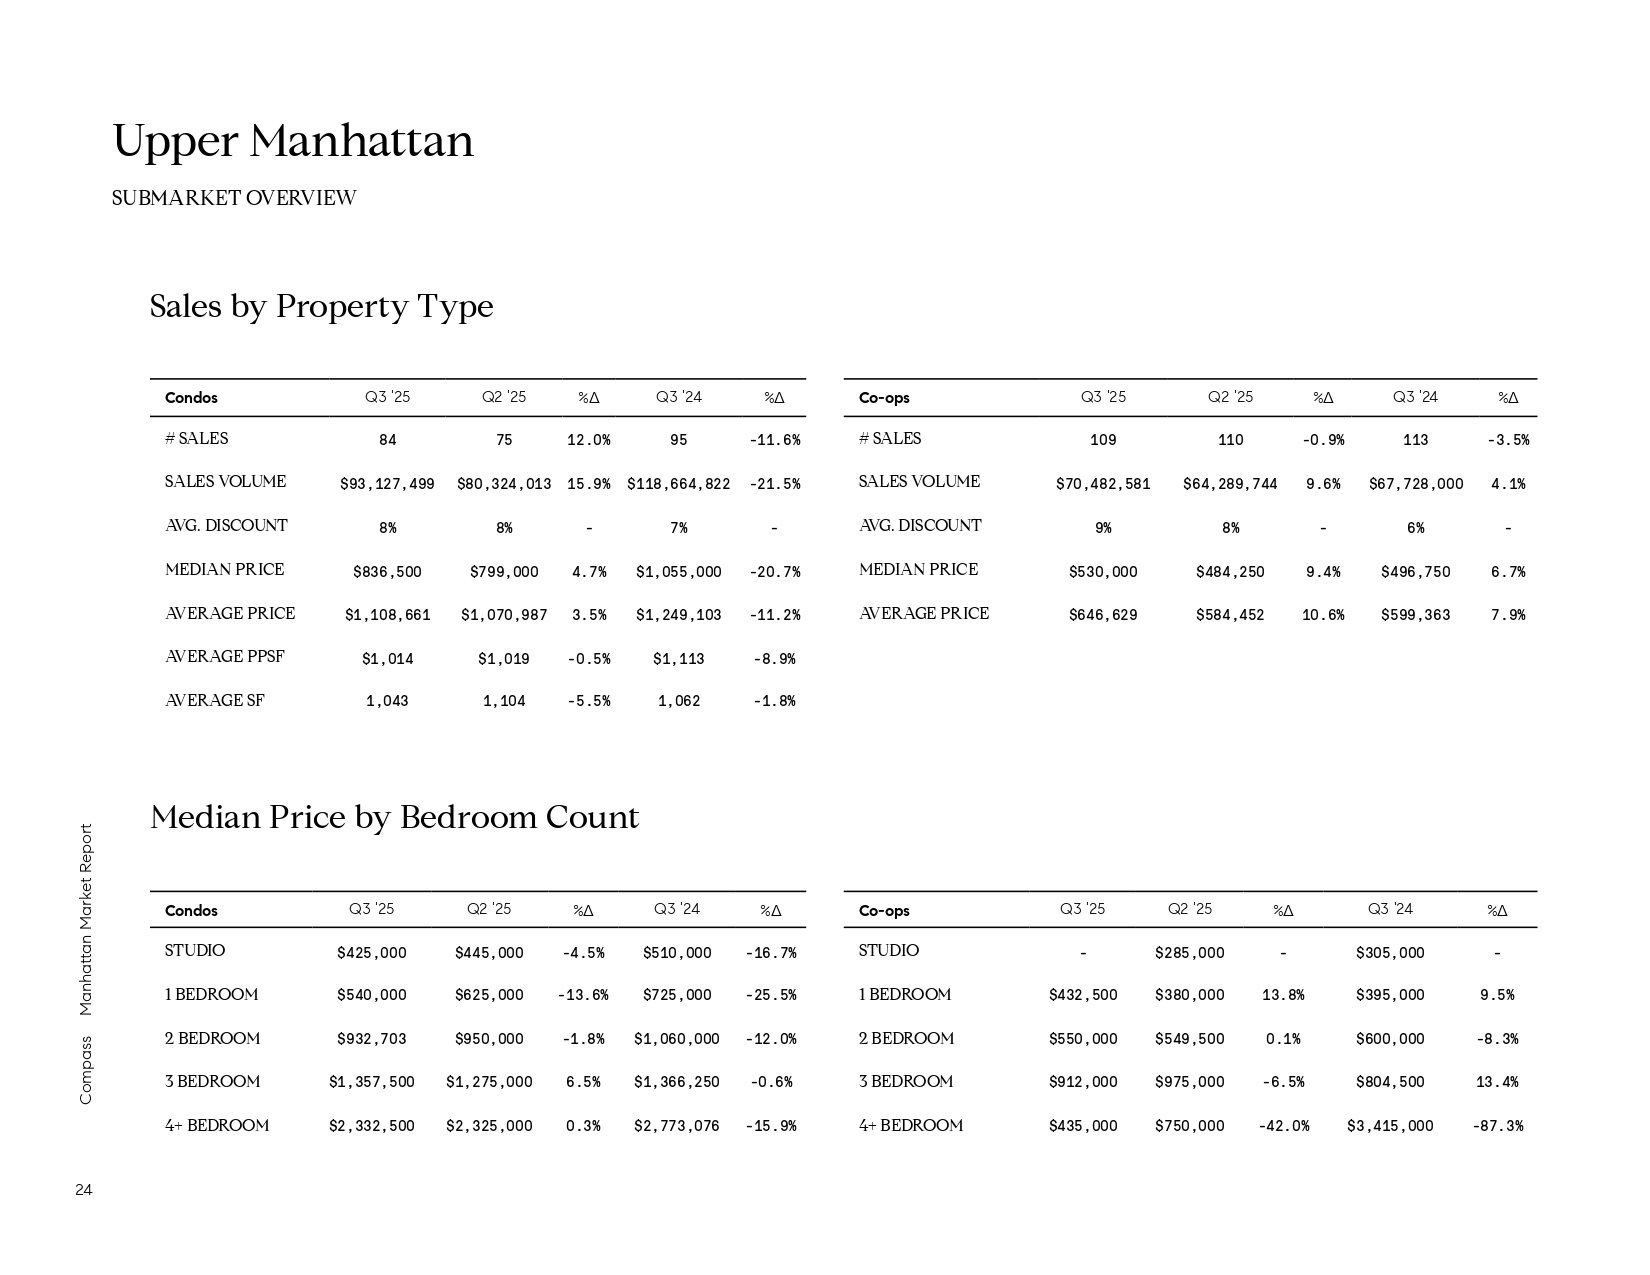
Upper Manhattan market report tables comparing condo and co-op sales and median prices by bedroom count.

Compass


Work With Us

The Pucker | Heinlein Team consults and services individual buyers, sellers, real estate investors and developers across the city and offers partnerships throughout the country to service clients’ real estate needs.

Follow Us On Instagram